The standard T-test assumes that all samples are drawn at random from a population. But this may not be the case.
For example, you might select test subjects at random, but then perform two measurements on each subject, for example both before and after a medical treatment.
This is called a Paired T-test (or a dependent sample T-test).
This pairing makes the test more powerful than the standard T-test, as there is no random variation between subjects - the focus can be on the difference measured for each subject.
How to perform a Paired T-test
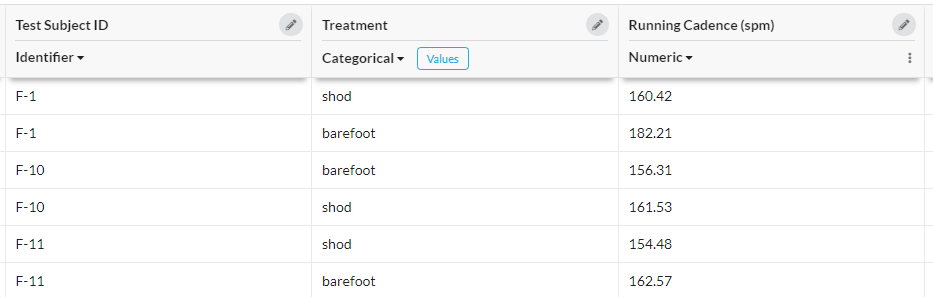
Your data table will need three variables, as compared to two for the standard T-test:
- The Numeric Dependent variable (value being measured)
- A Categorical Independent Variable (grouping the samples into the two groups being compared)
- An Identifier variable, which for each sample identifies which test subject has been measured
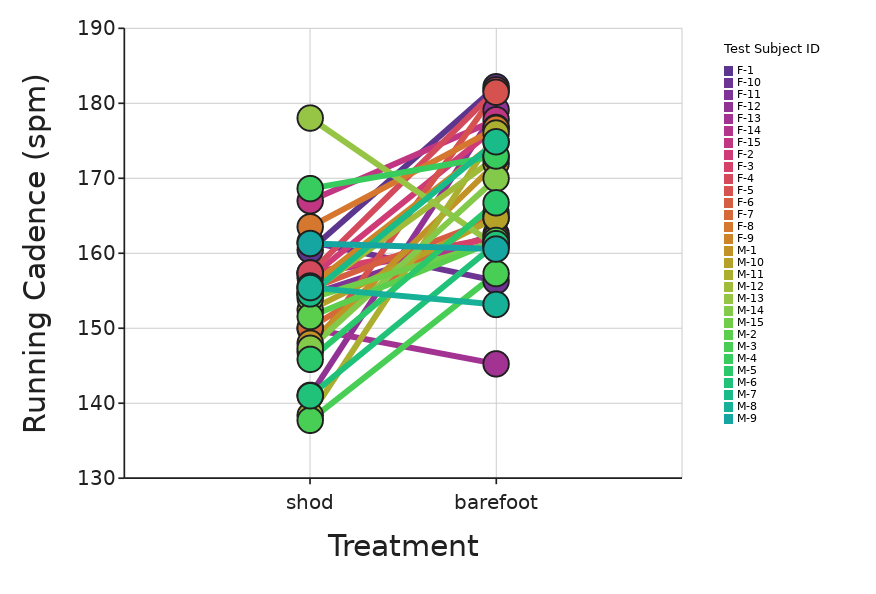
These can then be visualized as a dot plot in one of two ways, either with the Identifier as the Z axis:
Or with the Identifier as the X axis:
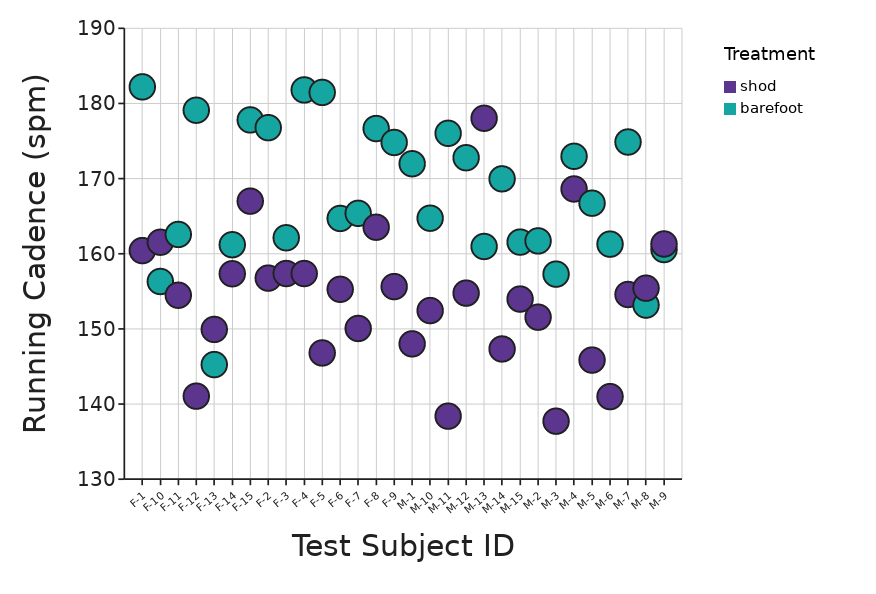
Both of these visualizations can give you an idea of whether there is a visible effect of the treatment.
Running the test
Then you can run a Graph-Driven Paired T-test on the data. See how to do this here. NOTE: you'll need to check the "Advanced ..." box.
You can also run this test directly from the Hypothesis test option on the left-hand menu as described here.