Having run an ANOVA or 2-way ANOVA test, you will have received a P-value which tells you about the likelihood of there being a significant difference between some of the groups. But it doesn't tell you which groups differ from which (In the T-test, there are only two groups, so the question does not arise).
This is where a Tukey's post-hoc test comes in.
You should see the button below the table of results:

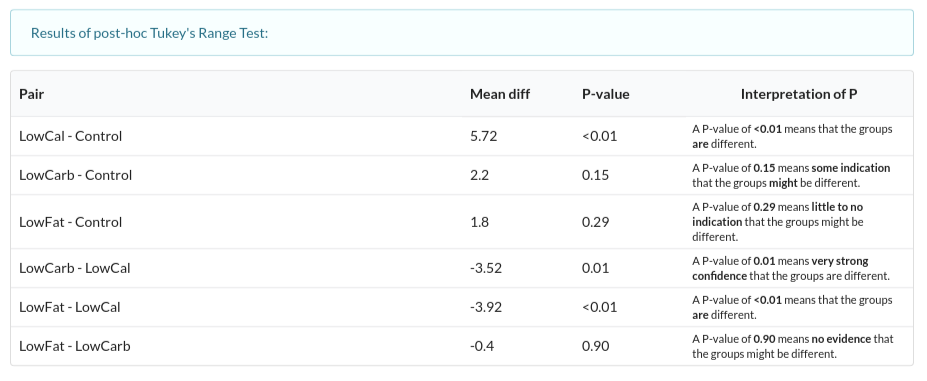
And running the test gives you something like this table, where you can see each of the four groups compared with each of the other three.

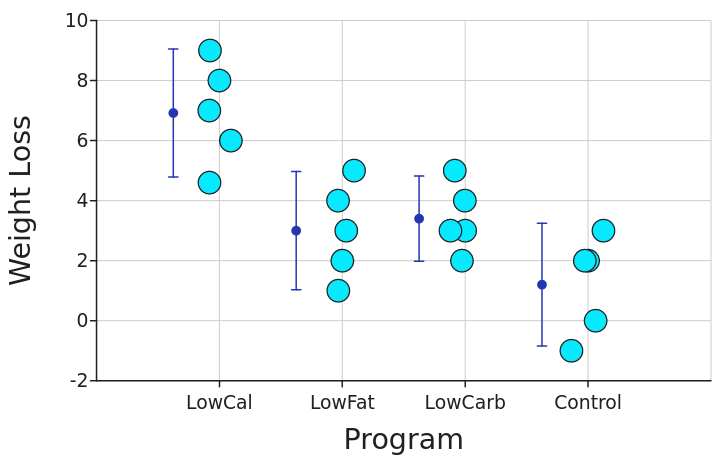
So what does this mean? If you look at the table carefully, you'll see that all the P-values associated with the LowCal group are significant (under 0.05), and this should correlate with what your eyes tell you when you look at the graph (mean and 95% confidence interval shown), i.e. that the LowCal group is the one that is different from all the others:
