An Interactive Analysis is a process where the user goes through a step-by-step visualization of a statistical hypothesis test.
Running an analysis performs a fully accurate hypothesis test on the data you provide, but also:
- Takes you through a visualization of the math, where you are asked to contribute and (yes!) think about what is happening.
- Writes up a "Lab Notebook", detailing the process with appropriate language. You can download this as a Word file.
- Generates a PDF of the Notebook, which can be downloaded.
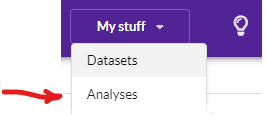
You can go back and forward through the Analysis or stop at any time and your progress will have been saved. Analyses that you have created can be seen in the Analyses list under the My Stuff menu:
Starting an Analysis
Start an Analysis by clicking on the Interactive Analysis button on the Flowchart.
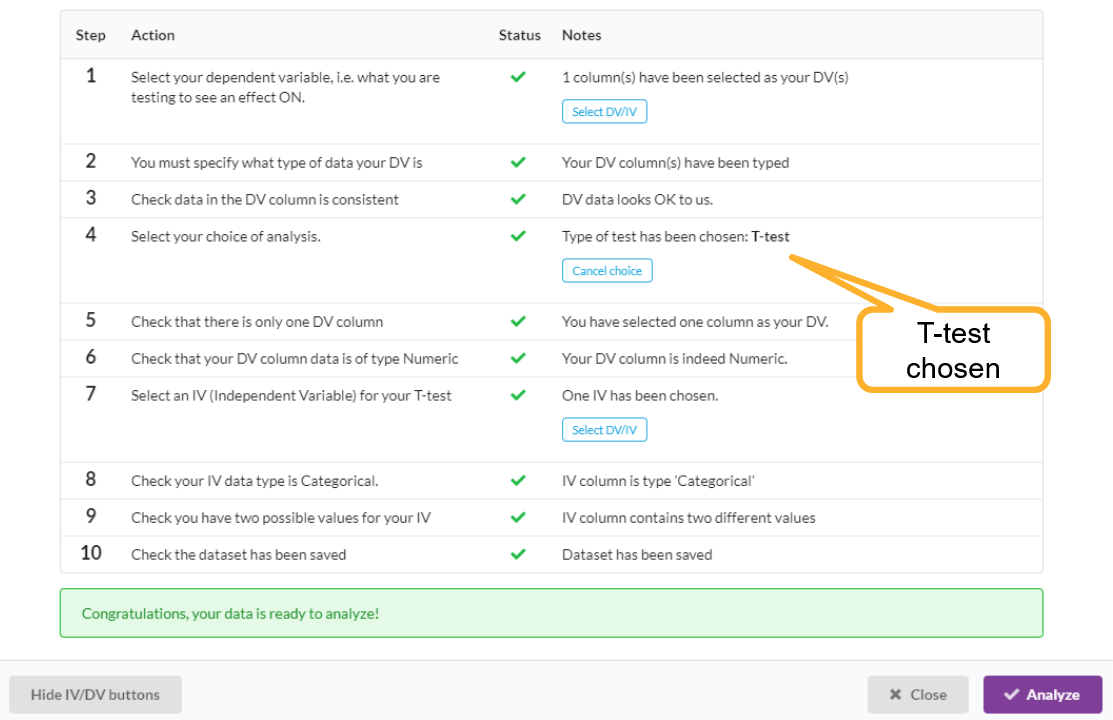
You will first have to prepare and save your dataset, and then you will be able to start the actual analysis. A checklist window will be shown, taking you through a number of steps that ensure you have data that is valid for the analysis. Checklist steps include:
- Selecting which variables (columns) you will use for your Dependent and (maybe) Independent Variables.
- Ensuring these columns have been typed appopriately.
- Selecting a test type.
- Saving the dataset.
All this preparation will be saved with your dataset. Next time you open it, it will already be prepared.
Once the checklist is complete, you can click the Analyze button:
The Analysis question
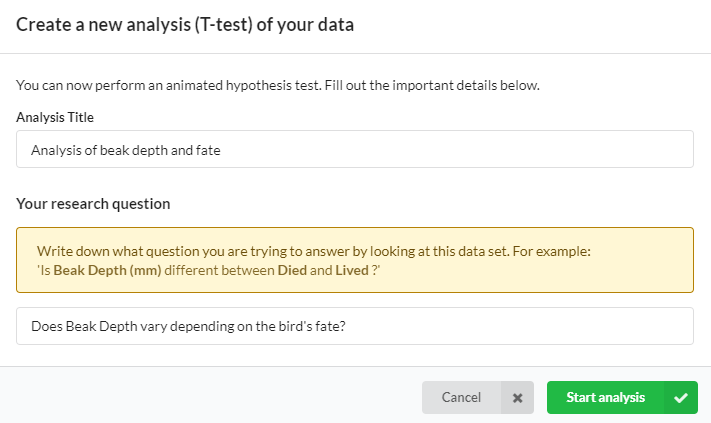
One more step to complete, and you'll be there. I promise. You need to give your analysis a title (like a filename, so you can find it again) and also specify your Research Question. This is important, as it is after all why you are going through this process - you are trying to get your data to answer a question.
The Analysis screen
When you click Start Analysis, your analysis will be created, and you'll see the initial screen. From here the Dialog will guide you, so here's just a quick intro to what is on this screen:
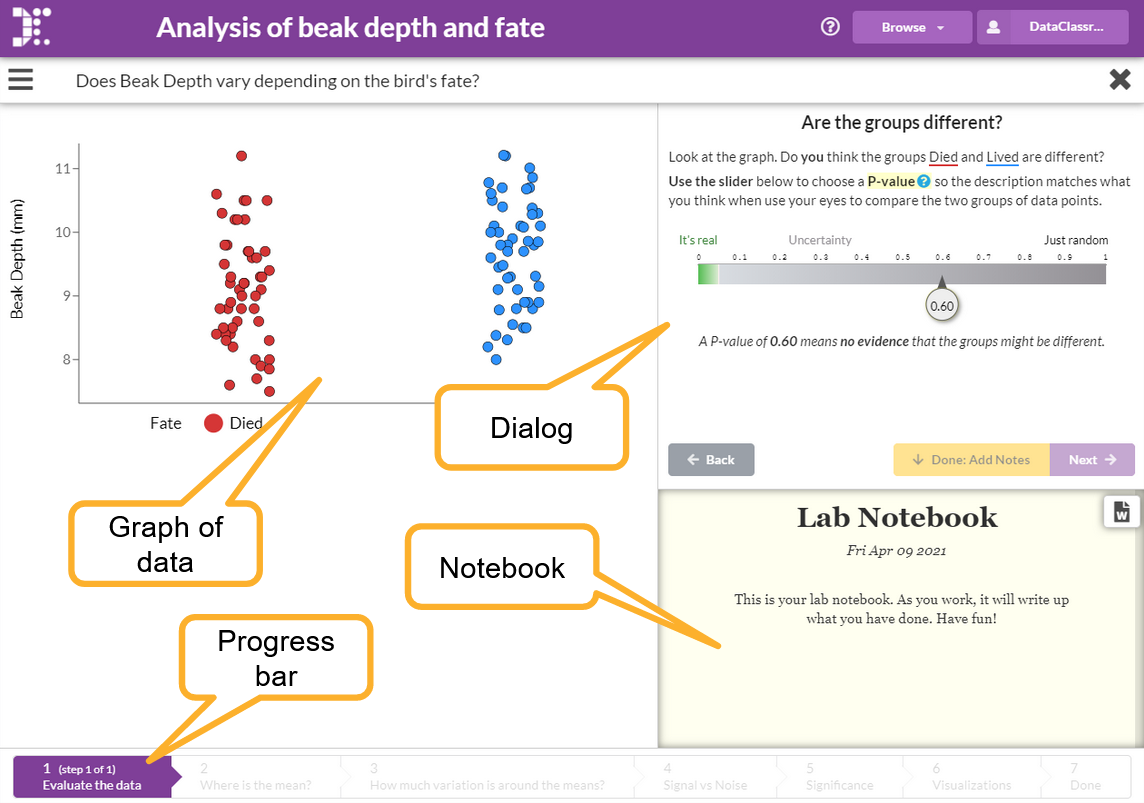
Note that the Dialog is asking you to think about what you are seeing, provides some reference information and is also asking you to take a decision based on your own estimation. Don't worry, it doesn't matter if you are right or wrong, the computer will still work out the correct result at the end. The important thing is to learn from the process.
You navigate forwards by doing things on the Dialog (and sometimes the Graph), pressing the Done and Next buttons.
Don't forget, your progress is saved as you go, so you can always leave off and come back. You can also use the Back button to back up a step or two.
Publishing results
The Lab Notebook can be published as a PDF. Once you've done this, it can be found and downloaded from the Browse -> Analyses list.