When you have a set of numerical measurements in a dataset which are varying randomly, it is often interesting to know if they are distributed normally.
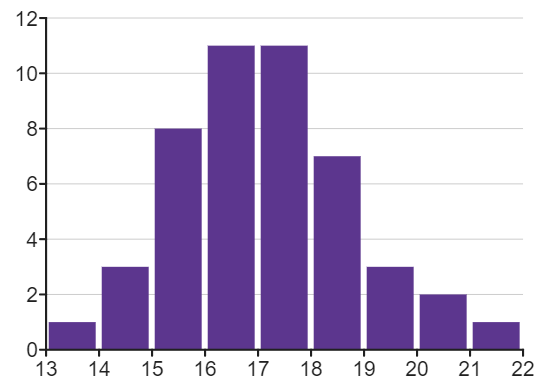
The normal distribution (also called Gaussian distribution) is the way a lot of phenomena in the natural world look, because they are the result of a huge number of random effects. For example the height of a person will be affected by a large number of their genes, but also many environmental factors. So if you take 50 people of roughly the same age and plot their heights in a histogram, you might see the classic normal distribution.
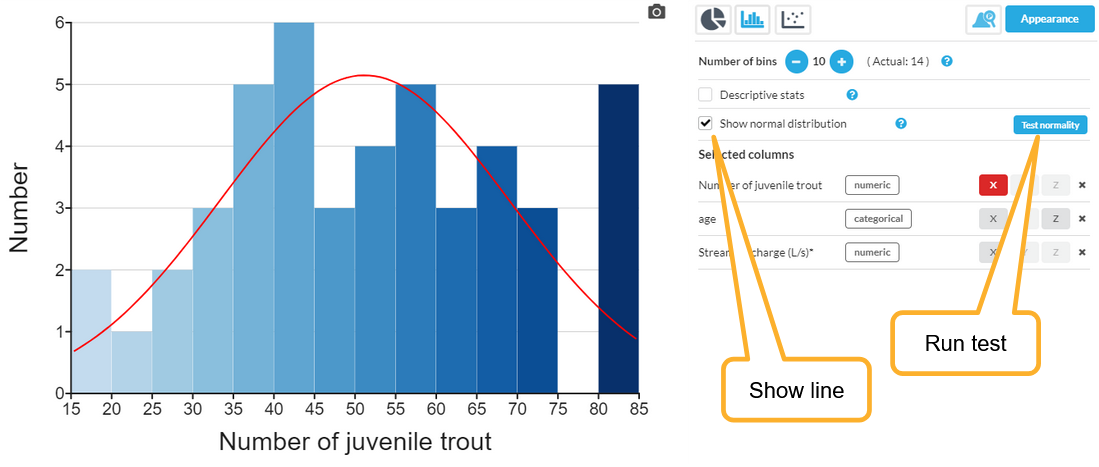
 DataClassroom lets you draw an ideal normal distribution on top of your histogram, so you can see how well it matches. Check the "Show normal distribution" box to do this. There is also a button that will allow you to run a statistical test of normality:
 The area under the curve of the red line is the same as the area of the bars. So you can see how the bars would have looked, if you had a lot of them and the data was exactly normally distributed. You can use your judgement to see if you think it looks "normal", or if there is something clearly "strange" that needs explaining.
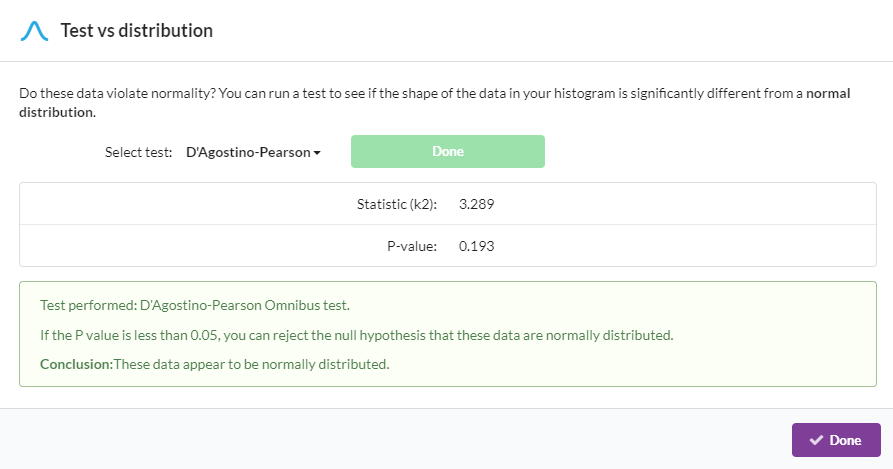
Many statistical tests require (in order to be valid) that the data tested comes from a normally distributed population. If you run a test, either the D'Agostino-Pearson or the Shapiro-Wilk, this will give you a P-value which expresses the likelihood of this being the case. For example:

These two tests will not give you the same P-value, but they will generally agree on whether the data are normally distributed.