For numeric axes, the tool will automatically select an axis extent that will cover all your data points, and have some "sensible" values at each axis tick.
You might want to choose a different extent, for example if:
- You are making several graphs, and want the axes to be consistent
- You want to make sure the graph shows a full range e.g. from 0 to 100
- You want to show an extrapolation of a regression line
- You want to extend an axis for some other reason
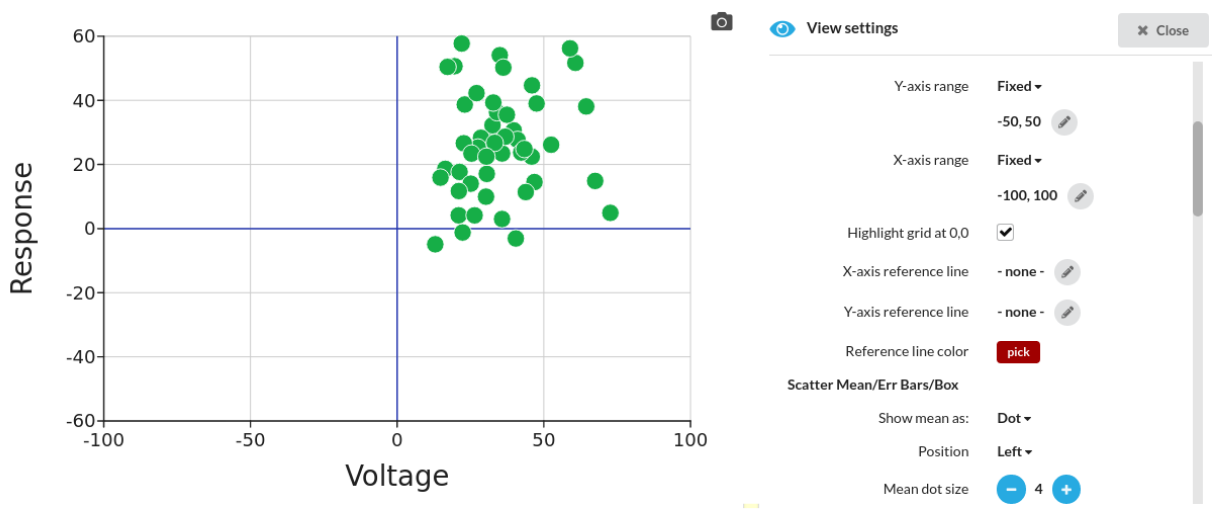
You can do this in the Appearance menu, under X-axis range and Y-axis range for the various graph types. Here is an example with a scatter plot where both axes are fixed, and a grid highlight has been applied to show the 0,0 axes: