You've probably seen that a categorical Z variable can be used to color your data on a graph.
But it can also be used to split your data up into further groups on the x-axis, both:
- Visually, so they appear separated on the graph
- Analytically, so each group gets its own descriptive stats / regression calculation / etc
This is done by clicking the Group By Z checkbox, which appears when it is relevant to use.
Dot plot grouping by Z
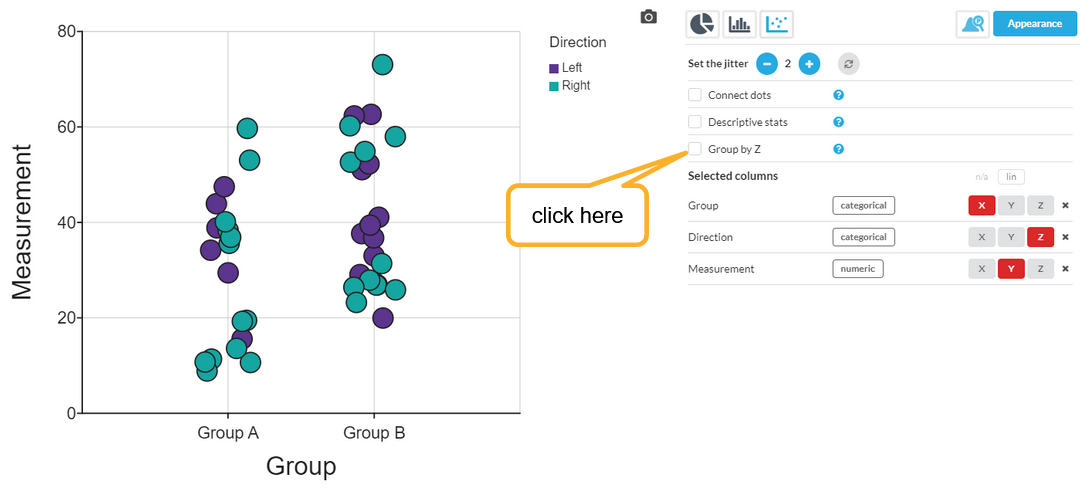
Here is an example of a dot plot which has had a categorical Z variable added, which is coloring the data points. As there is a categorical Z variable available, the Group By Z checkbox is visible:
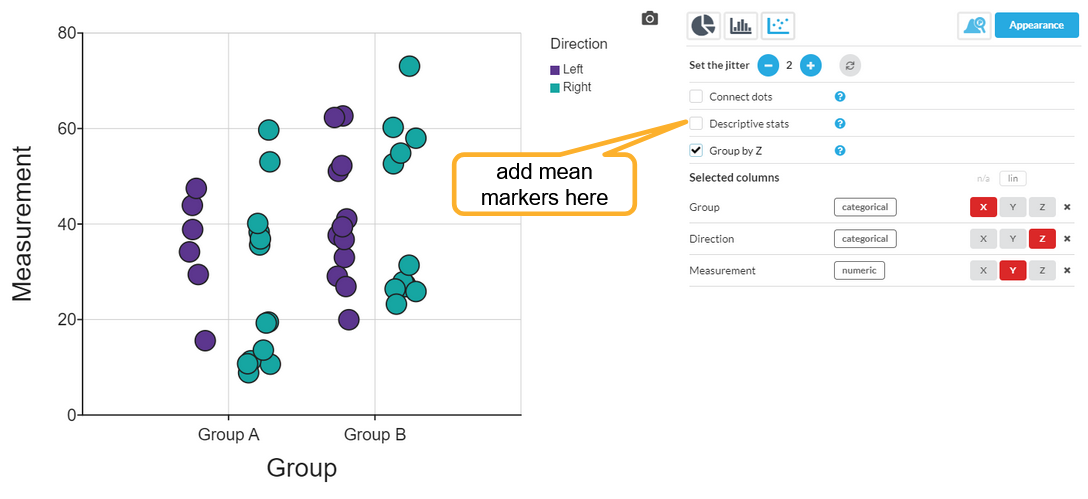
Checking the Group By Z box will result in the groups being split into four sub-groups:
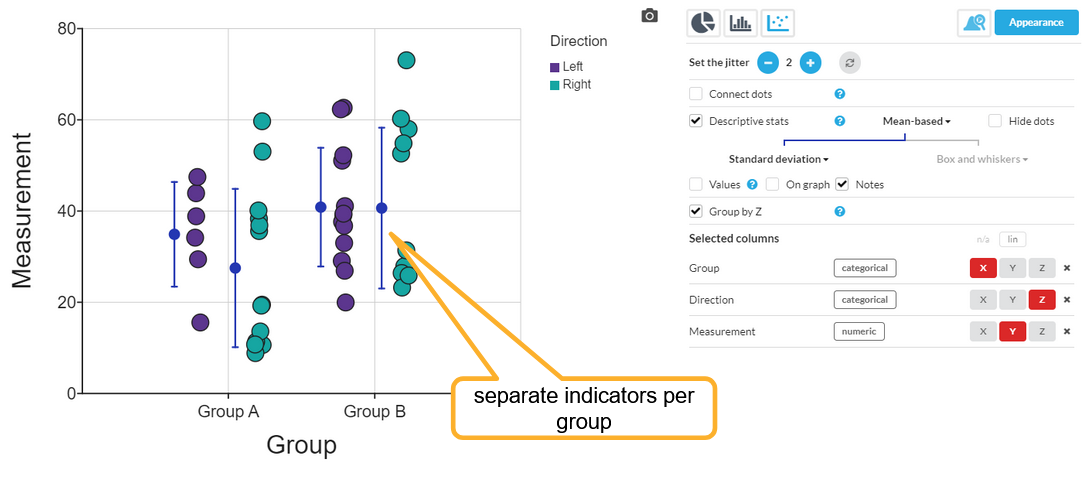
Each sub-group will be considered separate for purposes of calculations, so adding Descriptive Stats will show four indicators of the mean and standard deviation:
And if you show the Values Table for the descriptive stats, this will also now have four lines showing all the key statistics for each group separately.