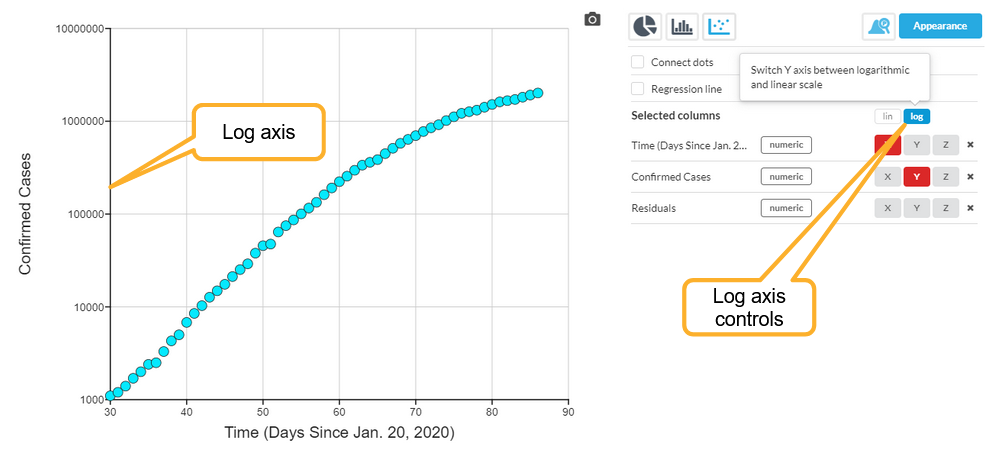
You can switch the X and Y axes on a scatter plot between linear and logarithmic scales (log axes) using the controls shown here.
Not seeing the control?
These controls are hidden by default. Adjust your settings to include the more advanced controls as described here.
The data values in the column(s) shown must be suitable for logarithmic conversion, for example it must:
- Not include the value zero
- Not have both positive and negative values
Either of these mean that the axis cannot be shown as a logarithmic axis.