To work with data in DataClassroom, you have to specify the "type" of the data in each column.
Columns you aren't planning to use on a graph or analyze don't have to be typed. But we recommend it in any case as a good practice.
There is a useful guide to the types in the Prepare step of the dataset flowchart, beside the "has each column had a type set?" check:

You may have to think a bit about what type the data in each column is. The available types are:
Numeric | A number that represents some characteristic or value that is being measured or controlled. It has some numerical meaning, e.g. one value is twice another value, or has a numerical relationship to another column. Examples: Height, weight, duration, temperature. Think carefully about how the number is being used. Is it as a 'label' to group data (for example splitting subjects up by month of birth)? In that case, it is Categorical. Examples of numbers that are not numeric data: ZIP code, Social Security number. |
Categorical | A value that is one of a limited and defined range of possibilities which is used to group or categorize observations. Usually text, but can also be a number, although in that case the number is just used as a label, rather than being something that can be calculated with. Examples of categories: Sex (male, female), Result (won, lost, drawn), Treatment (medicine, placebo). You can assign colors and / or labels for each category. E.g. if the values in your Result column are R, L, D you can give these labels "Won", "Lost" and "Drawn". See this article for details. |
Info | A purely informational value that will not be used in any calculations. For example, a survey might include the name or email address of its subjects, but this is unlikely to be relevant to any mathematical analysis. |
Identifier | A value that specifically identifies the subject of a sample. For example, the ID number of a test subject being measured before and after a treatment. Used with the Paired T-test. Read more about identifiers below. |
Sample Count | This is a number, but use only when it represents a count of samples relating to a value for a Categorical variable in another column. For example, if you have a Categorical column with two rows, values 'Heads' and 'Tails' then a Sample Count column could contain 'the number of times the coin landed this way'.
|

Additional types
You may come across other names, such as Ordinal, Continuous, Discrete... see this article for how they relate to the above in DataClassroom.
Time and date values
Dates and timestamps can be tricky. Sometimes the date/time is just for information, but if you want to use it in some way for analysis then you might want to convert it to a number.
For example, if you have "started" and "stopped" times in your dataset, but what you really want to calculate on is the duration (difference between these), it would be best to add an extra column with the calculated value.
Or, if the date is being used as a label (to group people by age) then adding a column with the calculated age would be a good idea.
See this article on Time and Date values in datasets.
If the data in the column looks "wrong" in any way according to the type selected, you'll see a red (error) or yellow (warning) triangle with the word fix in the column header.
Numerical columns will show you an error for values that are not numbers. Click Find/fix problems to solve. 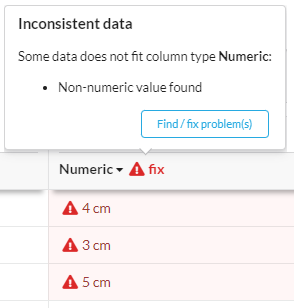
Numerical columns will also show a warning for empty cells. This is not necessarily a problem. These cells will just be ignored for any graphing or calculations. Click Find/fix problems to solve or turn off the warning.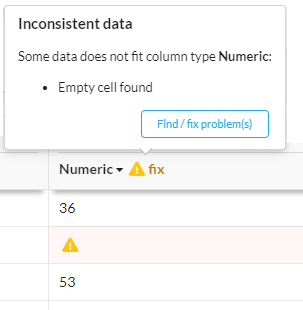
Categorical columns will warn you when you try to set them to Categorical if:
- There are too many (more than 60) different values. This may be a hint that these values are not really categories, but some form of ID or description, when there are so many of them.
- There are empty cells. You can choose to either fill them with a specific value (like "no answer" or "not measured") if you want to use these rows in graphs or analysis, or you can click "Leave empty" and then they will just be ignored in graphs and calculations.

Identifier columns
As an Identifier variable identifies a 'subject' for a row of data, the tool expects to see that either
- There is one unique identifier value per row (e.g. Test Subject ID), or
- There are a small number of rows (2, 3, 4 ...) that share each identifier value. For example, there might be two rows for each different Test Subject ID, one with data taken before a treatment, and one with data from after the treatment. That would be a classic setup for a Paired T-test.
DataClassroom will warn you if you try to set a column to Identifier and neither of the above is the case. It's most likely that you might want to use a Categorical type instead. However, it is up to you.