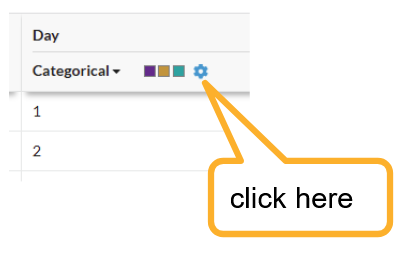
Personalize or make changes to categorical variables by clicking on the gear icon under your variable to get started:
From here, you can :
Filter / exclude categories of data
Label Values
Customize Colors
Reorder your values
Filtering Categorical Values
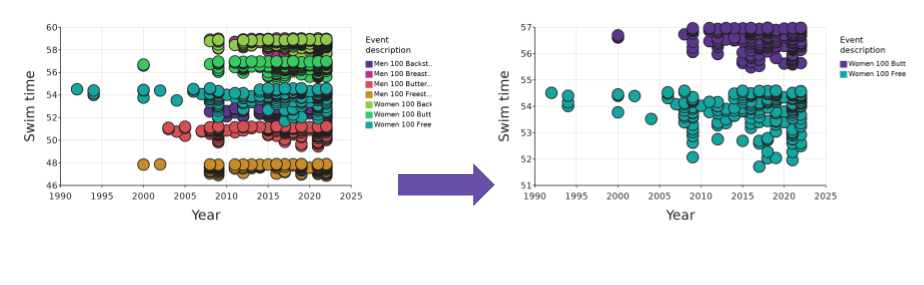
If you're hoping to explore data for just one of your values, or maybe exclude an entire categorical value, there is a faster solution than going row-by-row.
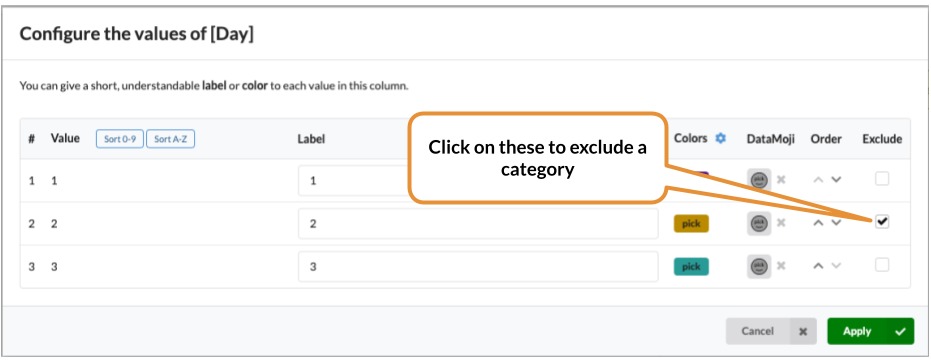
Click on the box in the variable row you wish you exclude. You can select more than one variable.
Re-labelling values
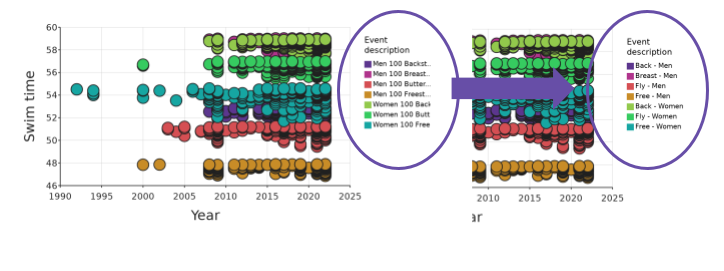
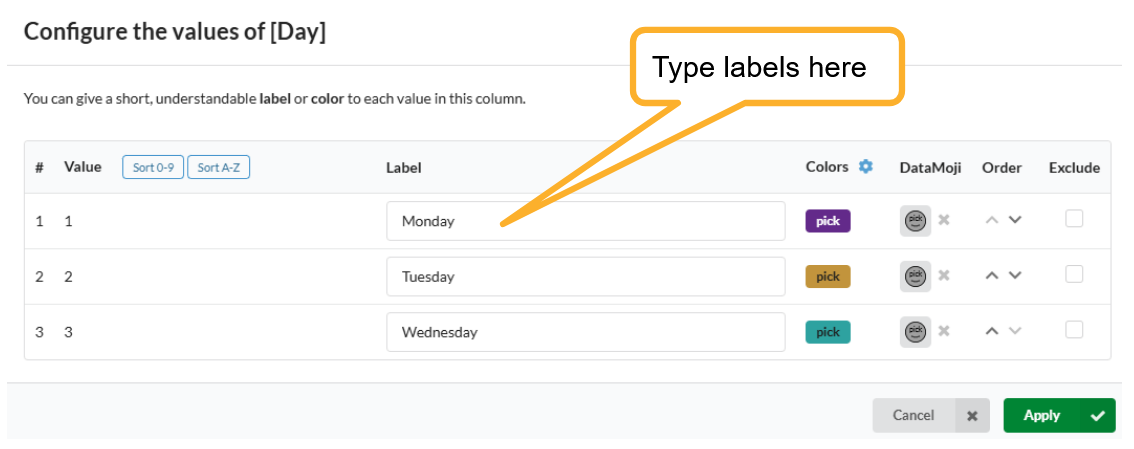
You can label each value with a meaningful title, instead of the original value from your dataset.
When you see the Values dialog, enter labels for each value:
See here to learn about how to use DataMojis.
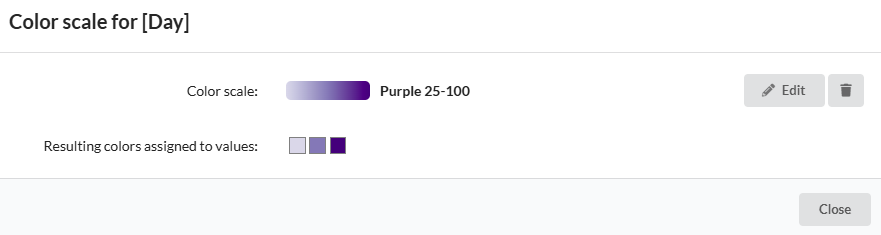
Customizing Colors
Assign specific colors to values or change the default color scale used to color the values automatically. Click the gear icon next to "Colors" to open the color scale selector:
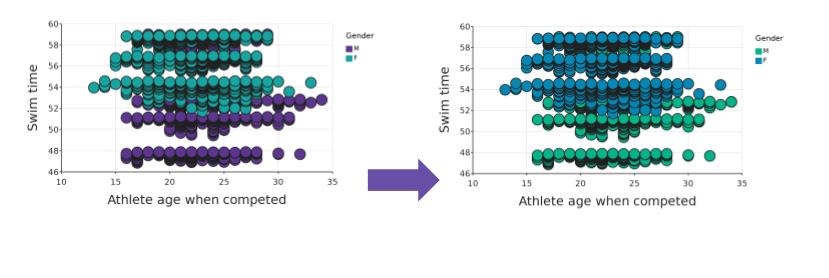
Or just click on each color to set a specific color for each value.
See also coloring by a categorical Z variable.
Reordering categorical variables
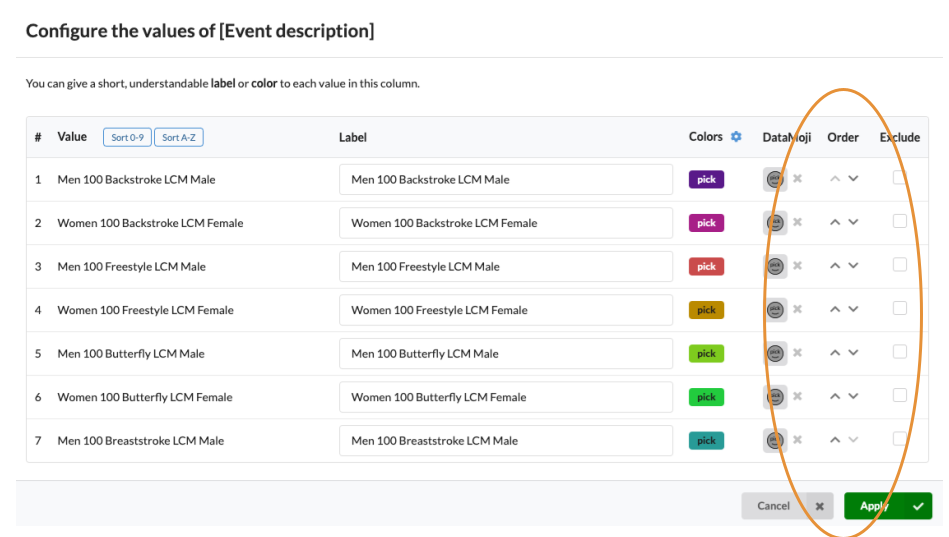
You will also have noticed the Order buttons. This allows you to set the order of the values, which otherwise are ordered in the order which they appear in the dataset. For example, if the above dataset had started with a Second Period data sample, then the labels on the graph would have been the other way around. Ordering lets you fix this kind of thing.
Using a DataMoji
There is even a button to allow you to display a particular DataMoji for each value. Have fun!