Once you have created a graph in DataClassroom, you may want to use that graph in a lab report, presentation or publication to communicate important information to the rest of the world. Exporting your graph to another document or platform can be done with a built in copy and paste function. Follow the steps below:
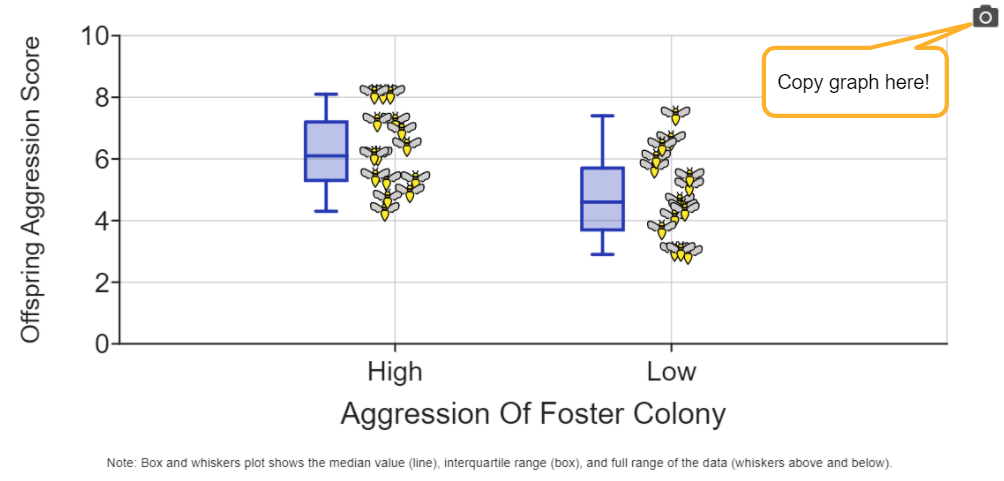
1) Click on the icon to copy your graph.
2) A pop-up window will appear. Click the Copy and Done buttons to save your graph to the clipboard.
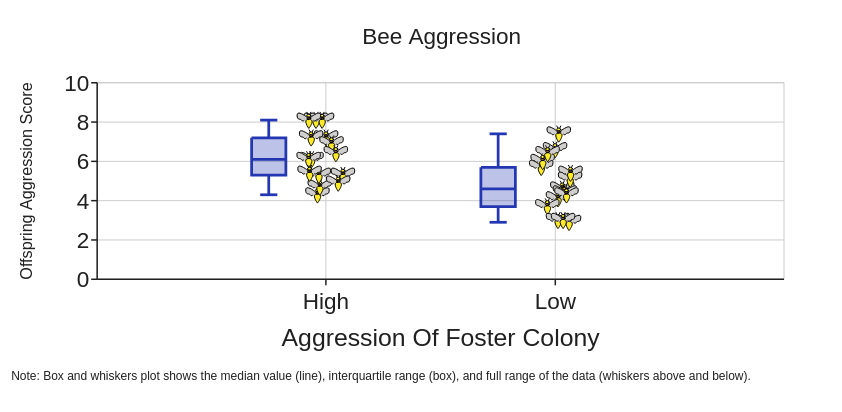
3) Paste your graph into the document (Google, Word, PowerPoint, etc.) of your choice.