Is this right page for you?
If you are looking to exclude or filter entire categorical variables, check out this page for how to do so.
Sometimes you want to exclude some specific rows of data in your dataset. This might be because:
- There is something wrong with the data (you can see from the values that it's been typed in wrong, like if a person's height was set to 12 feet, but you don't know what the right value should have been).
- You want to show just a subset of your data on the graph (you collected data from three classes, but only want to show for two of them)
How do I do it?
In the TABLE tab, click the Excluded checkbox at the end of each row:
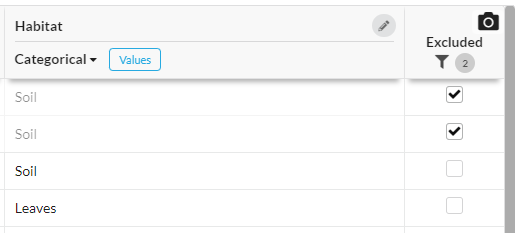
Excluded rows are removed from all functions in the tool - graphing, calculations, everything. It's like they weren't there.
Excluding many rows with similar values
Three options to exclude:
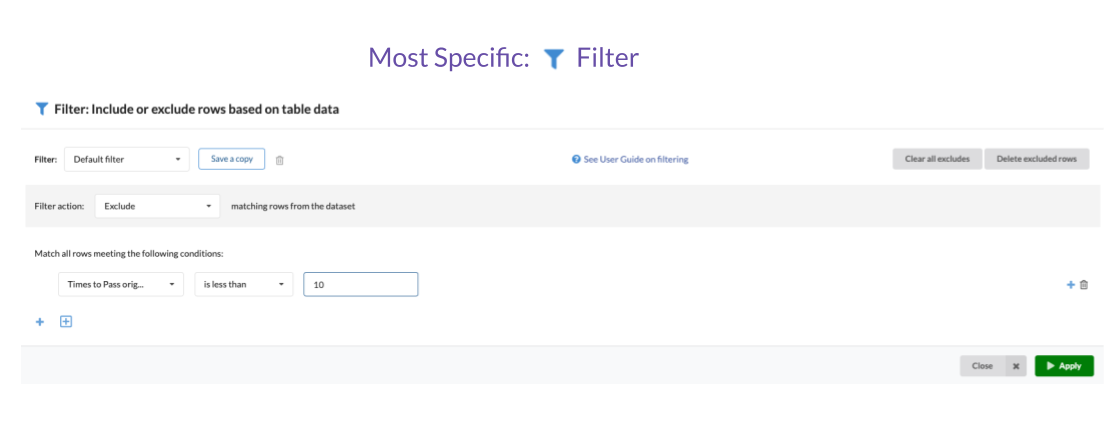
Use a Filter to set the exclude checkboxes dependent on the contents of one or more columns. See this article for details.
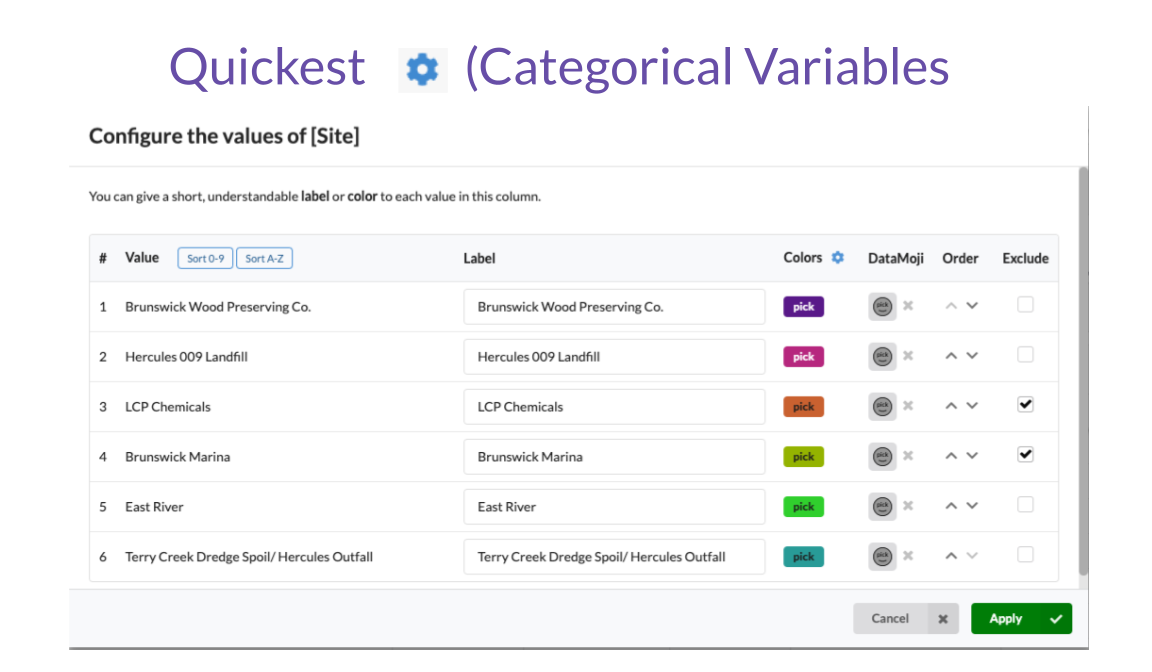
Exclude by value of a Categorical column. Open the gear icon for the column and use the Exclude tools there. Read more specifics here.
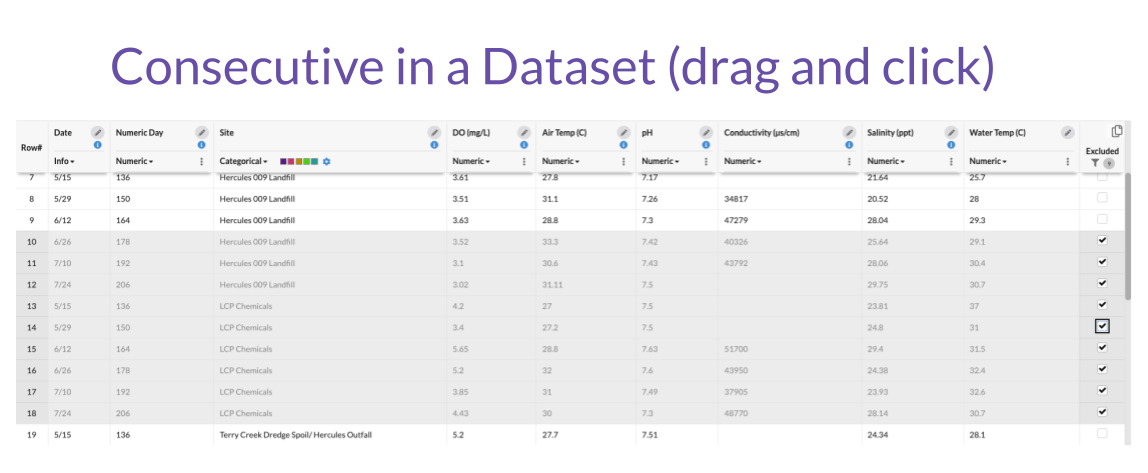
Select all the rows in a range (drag down the left row# column to select the rows, or click on the first row and then shift-click on the final row) and then click any Exclude checkbox in the range to exclude or de-exclude them all at once.