"Outliers" is a word used to describe data points that lie unusually far from the general grouping of the other points (see below for more detail).
These can be highlighted visually by showing the general distribution of the data as a descriptive statistics annotation - such as a box-and-whiskers (aka boxplot) or a dot-and-error-bars - and then just showing the data points that are calculated to be outliers, like this:

DataClassroom can show outliers as determined by one of the following methods:
- The 1.5 IQR rule. Outliers are data points which are above the 75% percentile of the data plus 1.5 times the distance between the 25% and 75% percentiles (the "IQR"), as seen on a boxplot. And those that are correspondingly below the 25% percentile minus 1.5 x IQR.
- The 2SD rule. Outliers are those which are further from the mean than 2 x the standard deviation. Usually seen on a plot showing the mean and standard deviation.
IQR stands for Interquartile Range, which is the distance from the 25th percentile to the 75th percentile.
How to show outliers
While showing descriptive stats, select Show outliers under the Show dots options:
You will be asked which method you want to choose:
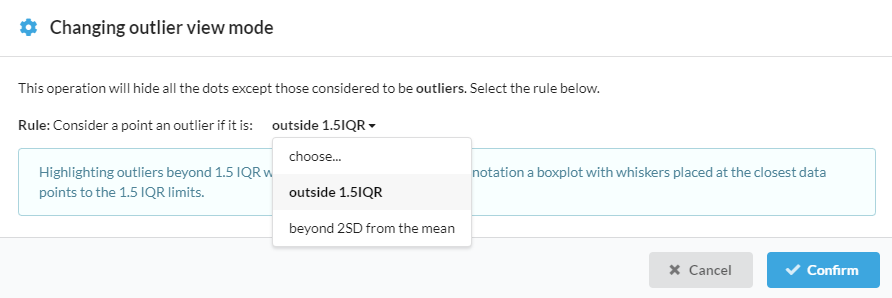
When you click Confirm:
- If you chose 1.5 IQR, your descriptive statistics setting will be set to "median-based" and the whiskers on the boxplot will show the 1.5 IQR range.
- If you chose 2 SD, the setting will be "mean-based" and the whiskers will show the 2SD range.
What (not) to do with outliers?
It is important to realize that there is nothing special about the 1.5 IQR range, or the points that lie outside this range. It is an arbitrary range, but it was decided upon by John Tukey, the inventor of the box plot. And it has been widely used, especially when graphs were drawn with pencil and paper and drawing all the dots was too much like hard work, so a box-and-whiskers plot was used. We recommend showing all your data points in the dot plot, rather than replacing them with a box-and-whiskers representation.
Outlier points may well be perfectly valid data points, just ones that lie unusually far from the rest. DataClassroom will include them in all its calculations.
If you see a point that you realize lies far from the rest and you know a reason that makes it invalid (for example, someone has taken a temperature reading with a broken thermometer), then we recommend that you exclude the data point from your data set - and maybe make a note that you did that.