If you have a dataset and want to make several different graphs from the same data, you might want to be able to re-visit each visualization without having to change the graph options each time.
To do this, you can store a number of your graph configurations within the Dataset, and then easily switch between them.
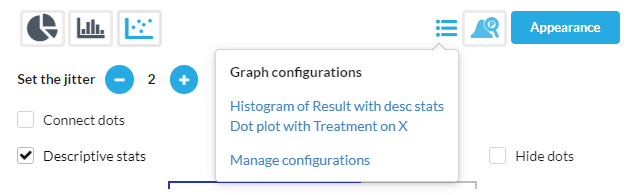
What is stored with a graph configuration?
Each configuration stores the following:
All the actual graph settings from the panel to the right of the graph. I.e. which graph type, which axes, whether descriptive stats are shown, etc.
All the graph appearance settings like the colors, font sizes, etc.
What isn't stored?
Anything from the data table, i.e. data contents, and which rows are excluded. (If you want to save different subsets of data, see Filtering rows of data)
Column headings, categorical value labels, colors etc.
Anything else non-graph related.
This means that you can save several graph configurations, and then use them easily again on different sets, or subsets, of your data. And if you decide to re-name a variable, you can quickly see all of your stored graphs rendered with the updated variable name.
Is the camera image stored?
No, only the configuration used to display the graph is stored. If you resize the screen, for example, you can make a new camera image with a different aspect ratio.