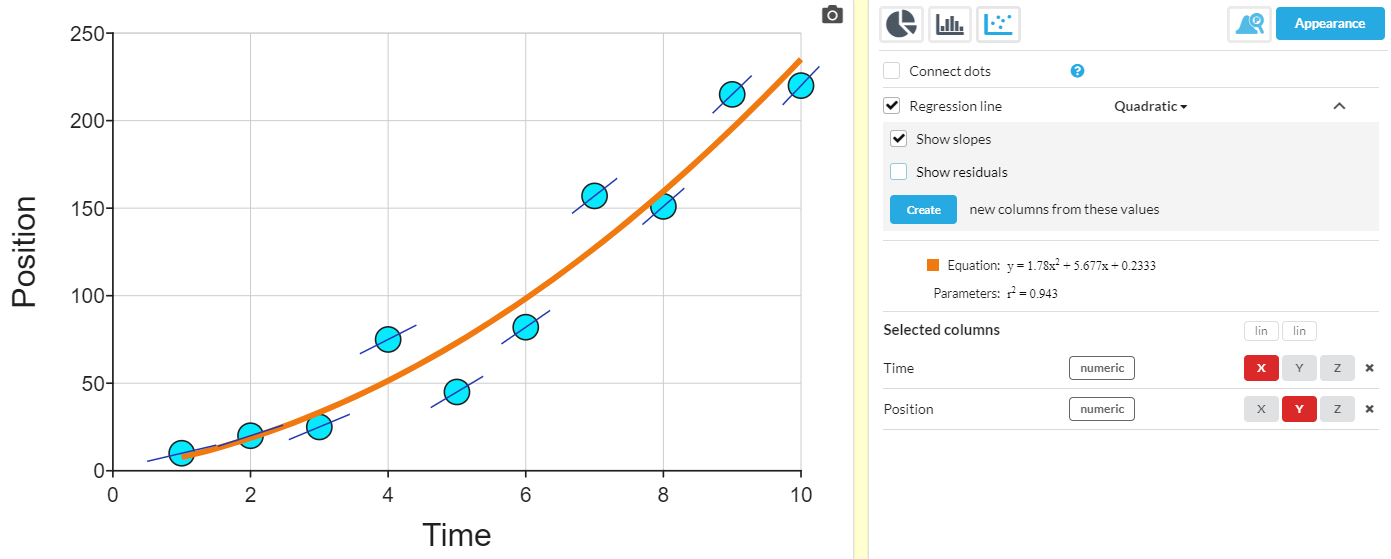
Having opened the advanced regression features menu on the graph controls, you can choose to add markers showing the slope of the regression line at each point.
These slope values are the first differential of the regression equation.
So, for example, if your data was a series of positions in time, then the slope values will represent the speed at these points in time.
The "Create new column from these values" button allows you to create and name a new column with the values, so you can then for example plot the speeds:
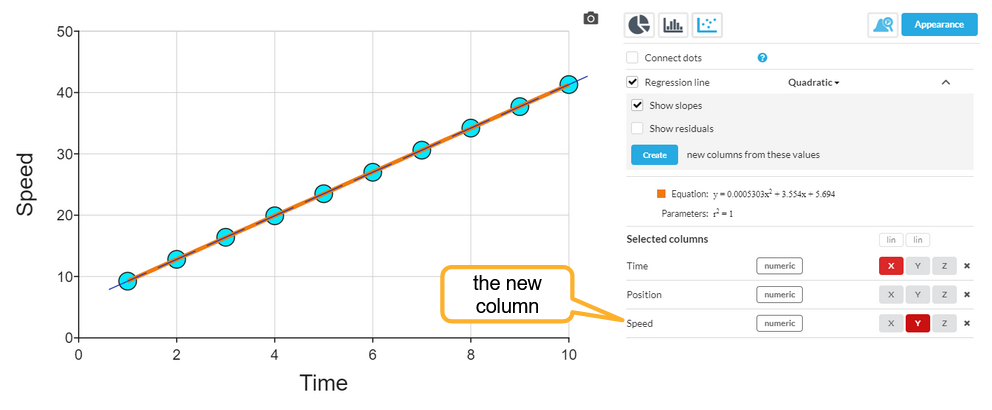
In this example, the speed is shown increasing exactly linearly. This is a consequence of the regression line being a quadratic equation, the differential of which will always be a linear equation.