When you have added a regression line to a graph, you can also:
- Visualize the residuals from the regression analysis
- Visualize the slopes of the equation at each point
- Generate additional data columns from the residual and slope values
Licensed feature
Residual and slope calculations require an active trial or a purchased license.
This page will focus on the residuals. See this other article about working with slopes (differentials).
To add these additional features to a regression graph, open the advanced features here:
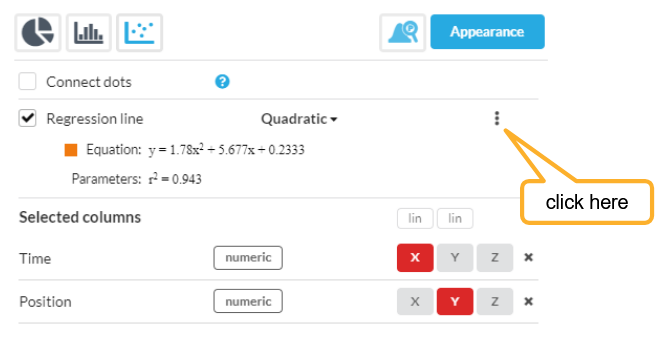
Then you can select to add Residuals and/or Slopes to the graph. This example has residuals added:
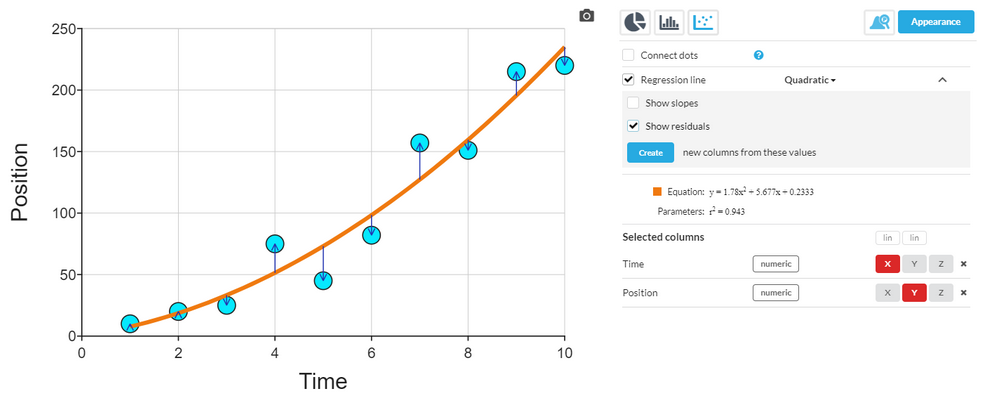
Residuals are the differences between the values on the regression line, and the actual sample values.
Slopes are the slope of the equation line at that X value (i.e. the first differential of the equation).
Clicking the "Create new columns from these values" button allows you to generate a new column in your dataset, with the slope and/or residual values, so these can be inspected and plotted.