The Kaplan-Meier curve displays time-to-event data. An 'event' is some clearly defined happening that only happens once, such as death, component failure, or similar.
The curve shows the survival rate over time, which starts at 1 (100% at time zero) and falls as time goes on.
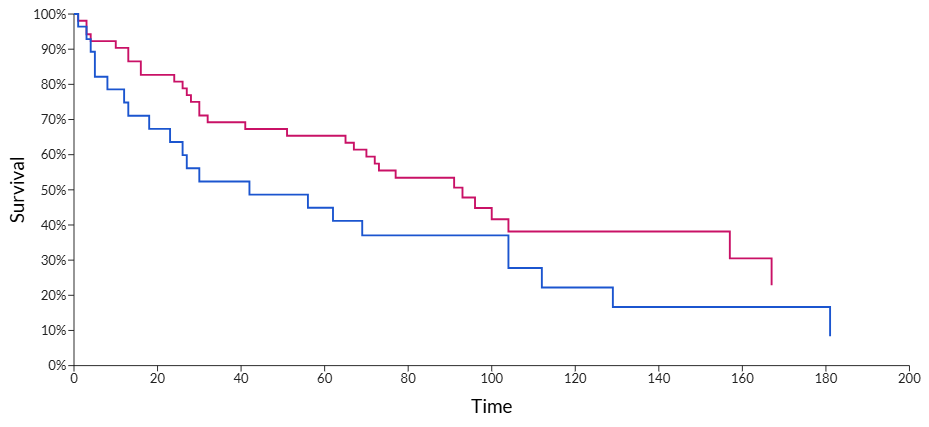
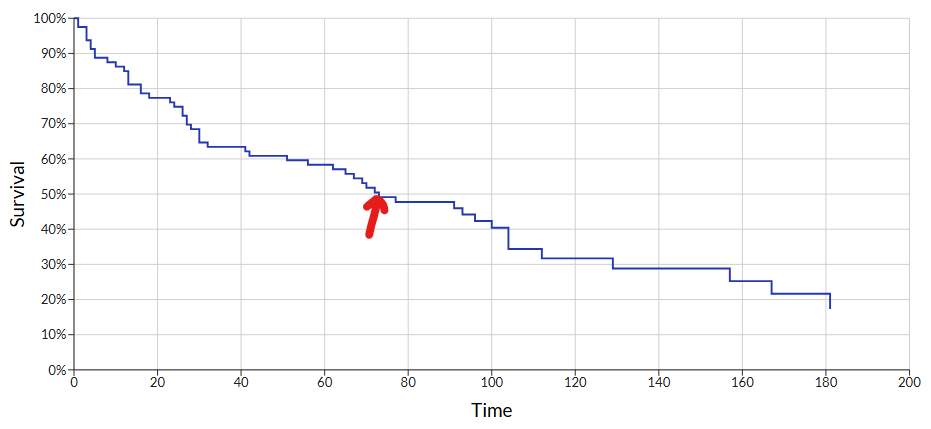 In this example, (see it on DataClassroom here) the red arrow shows there is a 50% survival at about 73 weeks.
To display this curve, your dataset needs to be in this standardized format:
- A numerical column with the Time to event variable
- One row per event, where Time to event specifies when the event happened
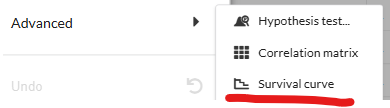
Then you just need to go to the Advanced -> Survival curve in the left-hand menu:
Display options
You can display the curve optionally with dots for the events, with or without gridlines, and you can also choose to view the data as a table.
Median and confidence interval
Beside the curve, you are also shown the calculated median survival time and 95% confidence intervals for that calculation. For the example above:
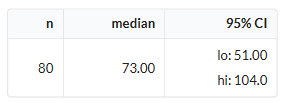
The table view also shows these figures for each step-down in survival probability.
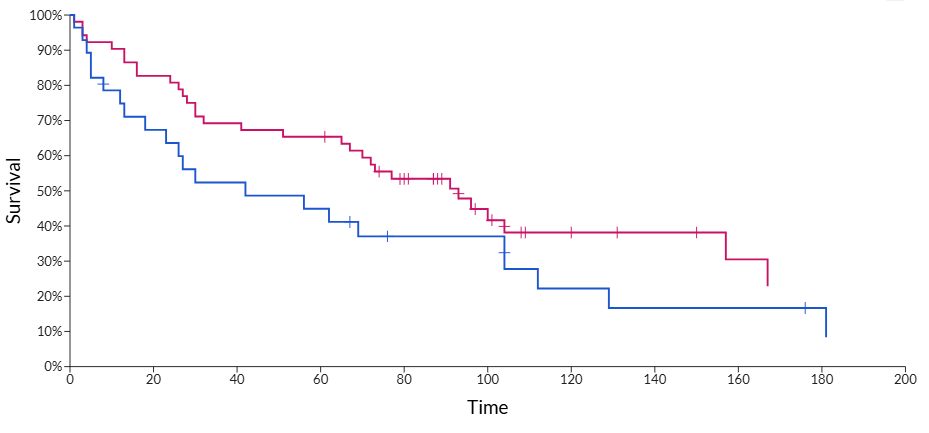
Multiple groups
If you have an additional categorical column that groups the events/subjects into categories, you can display several curves at once:
Study drop-outs aka censoring
In such a survival study, there may well be participants or test subjects that leave the study before it ends. To take account of these, you need to add a Status column that marks whether the row signifies a standard study 'event' like a death, or whether it is a 'censoring' event where the subject left the study.
The convention is that the status column be numeric with values 0 and 1, with a 1 signifying an event, and 0 meaning they were censored, i.e. left the study at that time. So if no-one left the study, this column would be all-ones. The column should set to Categorical, but Numeric is also accepted.
Note: The term 'censored' is also just a convention. It does not imply that anything is being deliberately hidden.
You can optionally show these censoring events as small crosses on the curve: