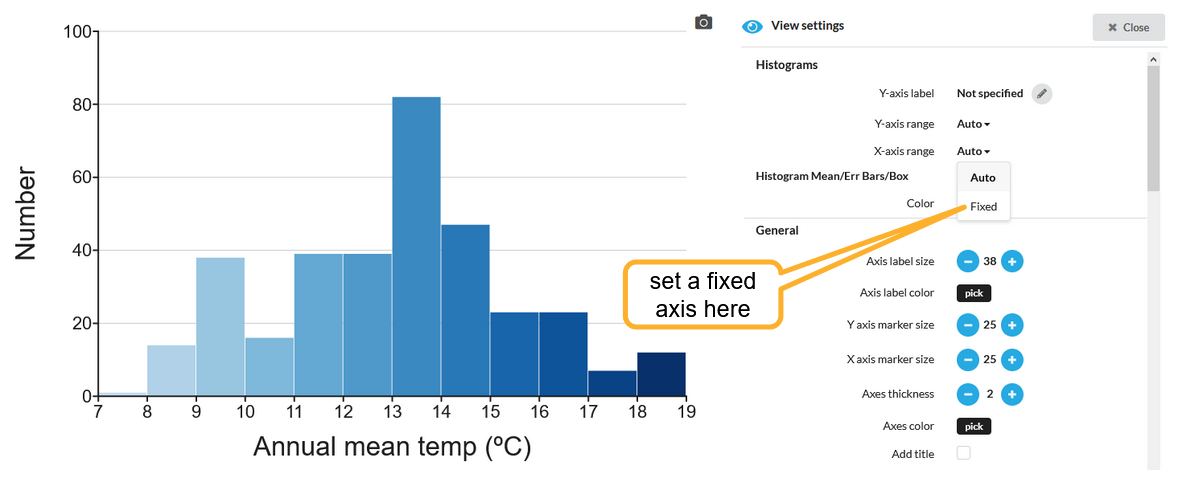
You will have seen that the tool will have chosen the range of your X axis depending on the range of your samples. Also, the number of bins depends on the range chosen (see here for more detail on this).
It always tries to make your data fill the whole graph. However, sometimes you want to choose the range yourself. Maybe you have several graphs with different data, and want to make the X axis always wide enough to fit the dataset with the widest range.
To do this, go to the Appearance menu and set a max / min range:

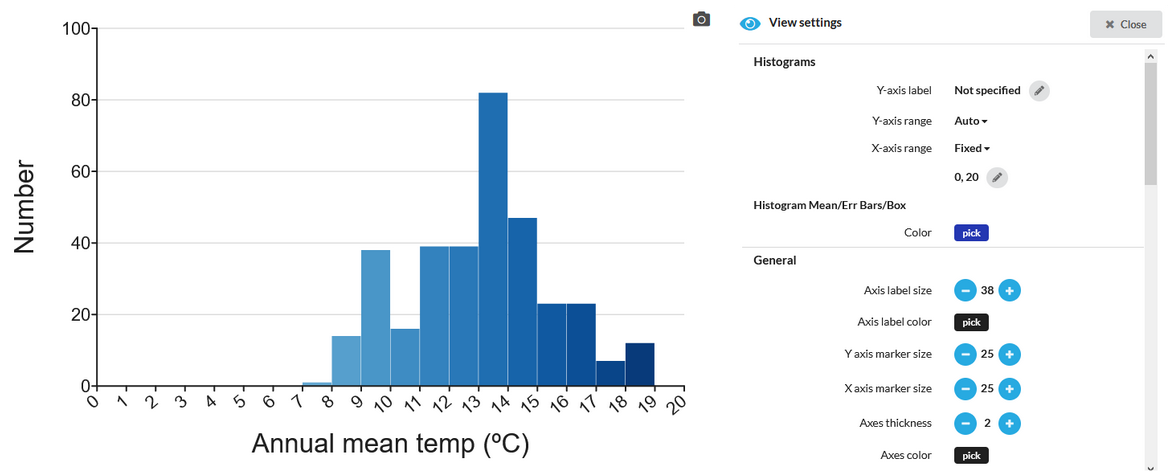
The tool will then use these values and the requested number of bins to draw an axis that fits your needs:

Here, the requested 15 bins and the axis choice of 0,20 has resulted in 20 bins with integer values.
See also
Setting the number of bins for a histogram