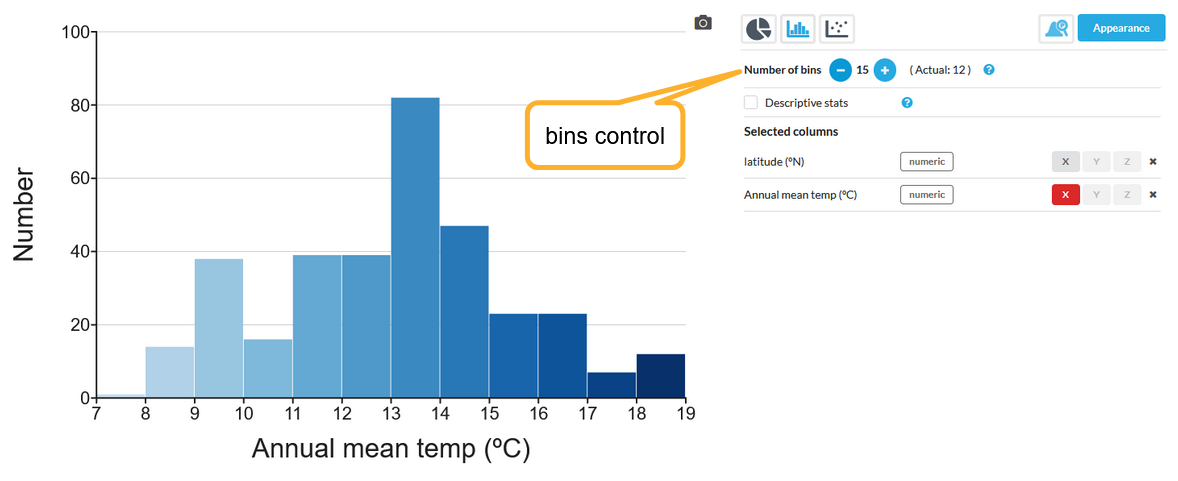
If you are displaying a histogram, you will see a control for the number of bins, like this:

You can select a number you want to have - like 15 in this example - and the tool will select the closest possible number that results in a "nice" scale on the X axis, in this case 12.
What do we mean by "nice"? It is slightly complicated, but it depends on your sample range. In the example above, there are sample values ranging between 7.3 and 18.8. The tool chooses a range so that there is at least one sample in the first and last bins, i.e. no empty bins at the end, and the numbers are as "round" as possible.
So here, it has decided that 12 bins between 7 and 19 makes the best approximation to 15 bins.
You can see that 15 bins would have resulted in X axis values like 7, 7.8, 8.6, 9.4 ... etc.
If you want to force the tool to choose a specific range for the X axis, see Histograms, setting the X axis.