The Graph-Driven Test is a concept where DataClassroom uses the way data has been visualized to recommend an appropriate statistical test from this list:
- T-test
- Chi-square goodness of fit
- Chi-square test of independence
- ANOVA
- 2-way ANOVA
- Linear regression
- Plus: more advanced tests including ANCOVA, Paired T-test, Repeated Measures ANOVA, Kruskal-Wallis etc... (see here for details)
See this blog post for some pedagogical background, and the video below for a demonstration.
To perform Graph-Driven Test (GDT), first set up a graph that visualizes your data. Let's say you are comparing two groups of measurements, and you are showing them in a way that allows you to compare their means:
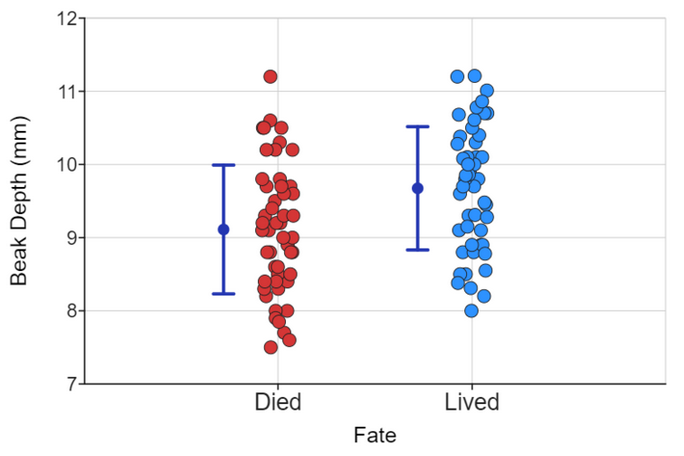
But you want to know: is the apparent difference in means statistically significant?
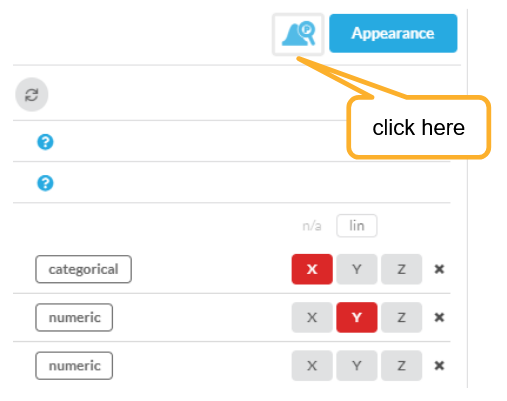
You can start the GDT from two places, the flowchart (Table tab):
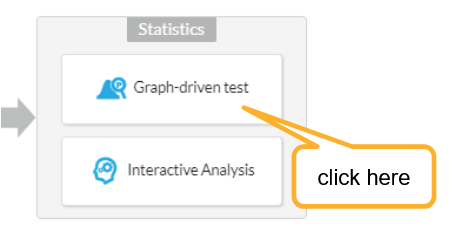
Or from the Graph tab click on this button:
Performing the test
Clicking the button will open the GDT window:
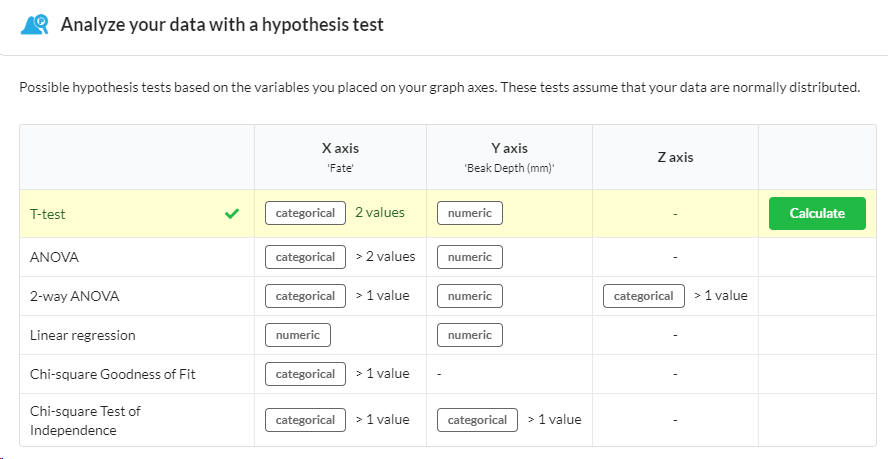
You can see a list of tests, what DataClassroom expects to see on each axis in order to choose that test. One row has been highlighted and has a Calculate button which will start the test.
Test results
Once the test has run (only takes a second or two) you see the results: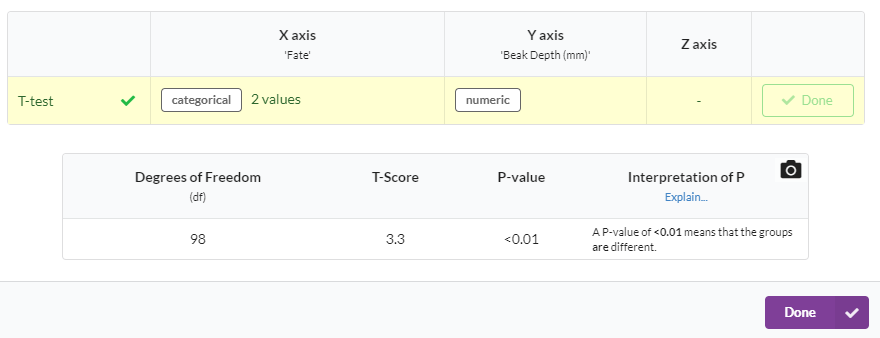
There is a table of numerical results, in this case the Degrees of Freedom, the T-Score and the P-value. These will vary depending on the test, but there will always be a P-value as the final result.
The P-value is presented both numerically and with a suggested interpretation.
- Clicking the Explain... link takes you to a page which allows you to explore the meaning of the P-value in more detail.
- Clicking the Camera icon copies the table to your clipboard, ready for pasting into a spreadsheet or document.