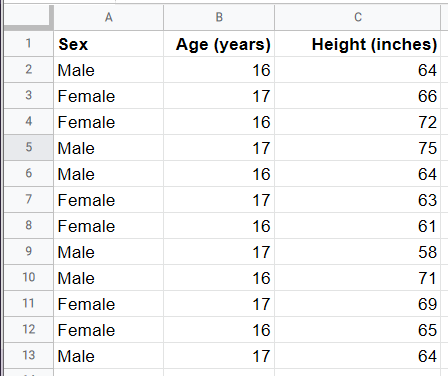
For analysis, the best way to have your data arranged is in a rows-and-columns format known as Tidy Data.
Using this "tidy" format means that you will be using a best practice that is used by all professional data analysis tools, and therefore building good habits for the future.
For an example, see this Google Sheet. It has:
- A first row, with headings that name the data in the columns (the variable names)
- All the data arranged in rows, with one sample or data point in each row.

In this example, you can see that each data point (row) represents one individual, and there are three variables (columns), which are either attributes (like Sex) or measurements/observations about that individual, like Height or Weight.
To read more about the advantages of Tidy Data, see this blog post.
If you have collected data which is not in this format, don't worry. See this article on converting data to tidy format.
Other formatting tips
- Don't add other rows with extra information on the same tab as your data. If you need to add extra information, put it in a separate tab.
- It's OK to add visual formatting like bold text, centering or left/right alignment.
- Excel and CSV can both be used. CSV has the advantage that it is "clean" and will not have any extraneous information, but can be less readable.
- If you are collecting survey data with Google Forms, keep the question names short and add any longer explanatory text for the question in the optional description field for each question. The question names will become the column headings when you export the results, so long sentences there will not be optimal.
Dr. Reedy talks about the importance of teaching tidy data in this short video (4 min):