For analysis it is important to format your data into the Tidy, or Long format that is the industry standard in both science and business.
Often data is collected and typed into a spreadsheet in a 'Wide' format that seems natural, but has some problems for use in analysis. Here is an example of Wide format:
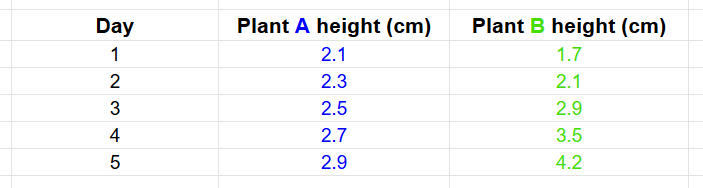
All the data is there. But in analysis, this format will run into problems because the data is not represented as variables. This can be complicated to understand, so we'll start with an example.
Example of conversion from wide into Tidy format
The process here is to combine the two columns of height data into a single column, and indicate which plant by a value in a second column:
- Work out what your 'value' variable is. This will be a common representation for the values from the columns to be combined. In this example, it would be Height. Add an empty column with this name.
- Add a second column, which will be categorical and contain values indicating which column the Height values in each row came from. In this example, it'll be Plant and have values A and B.
- Add a column with each variable name as heading.
- Make additional rows so you have a row for each sample (or measurement). Here you'll need to double the number of rows, as you are combining two columns.
- Move the height values to the new columns. The order of the rows does not matter.
- Duplicate values from other columns (Day in this example) from the rows where you take the values.
- Delete the original "Plant A height" and "Plant B height" columns.
(See below for how to automate this with the DataClassroom Melt function)
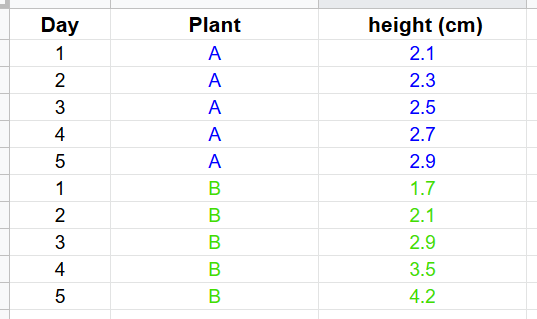
Sounds complex, but in practice not so bad. Here is the above data in tidy format. Make sense?
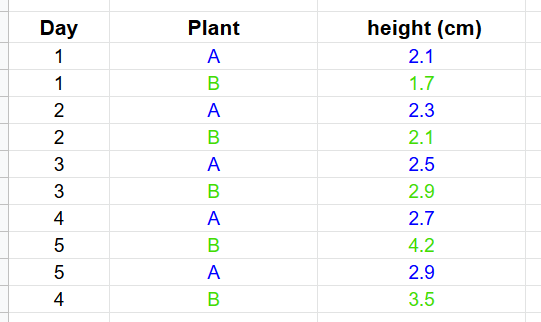
Or alternatively (this is exactly the same data, just ordered by day):
In this video watch Dr. Reedy work through two different examples as he tidies datasets with more than one variable in a column, multiple tables on a sheet, and hidden variables:
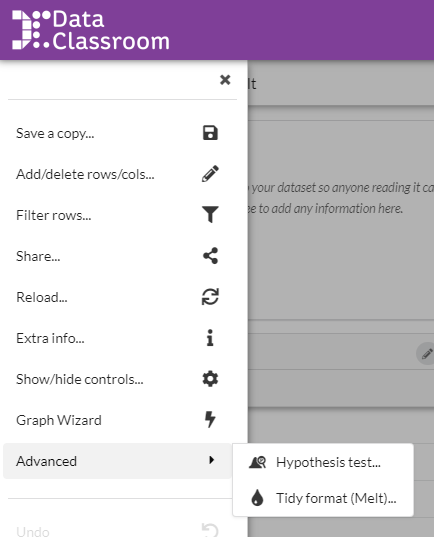
Use the Melt function to easily convert the data
If you know what you want to achieve, you can get DataClassroom to do the actual data reorganization with the Melt function. This is under the Advanced section of the left-hand menu:
See this article with details on how to use the Melt function.