You've probably seen that a categorical Z variable can be used to color your data on a graph.
But it can also be used to display a graph with multiple lines or to display multiple series of data:
- Visually, so they appear separated on the graph
- Analytically, so each group gets its own regression calculation
Multiple line graph
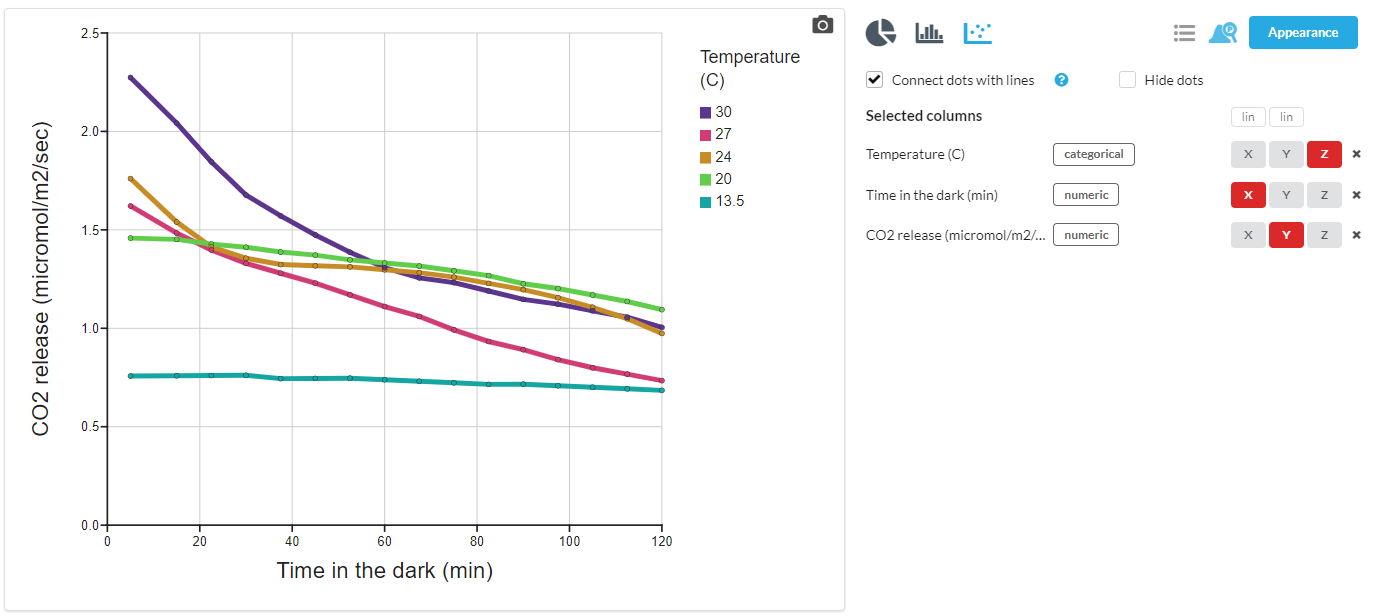
Here is an example of a line graph where a categorical grouping variable (in this case the experimental group temperature) is used as the Z variable.
Together with the Connect dots with lines option this makes a multiple line graph. A line will be drawn for each value of the Z variable.
Multiple regression lines
If you are instead wanting to show multiple regression lines, then see this article.