Before you play with color, pick your z-variable:
Using Color to Visualize the z variable:
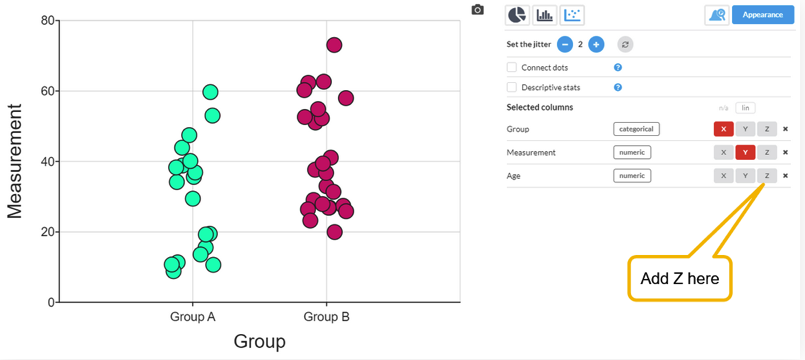
If you add a categorical Z variable to a dot plot, histogram or a bar chart it will color the data points according to the category. This can help you see visually if there is a correlation between the Z variable and the others.
Dot plot
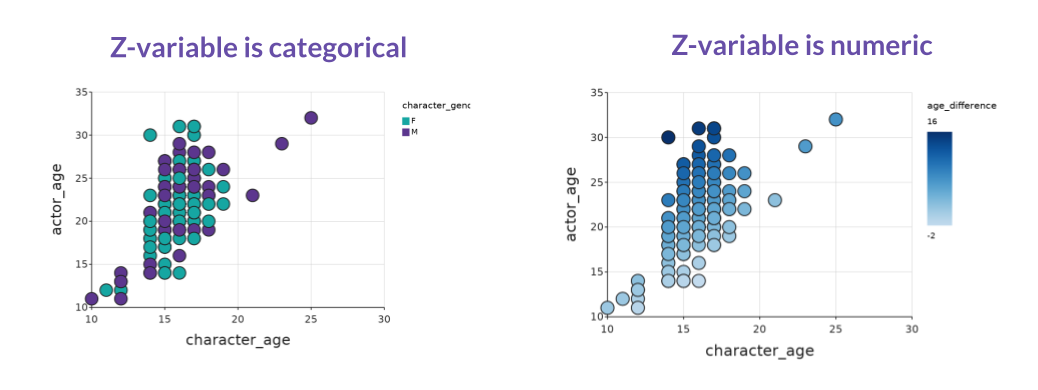
Here is an example of the same graph, but two different z-variable types:
- Categorical - Character Gender has two values, F and M and is represented by two distinct colors
- Numeric - age difference creates a scale of color to represent the numerical values.
Histogram
In the histogram case (numerical X, categorical Z) the histogram will be divided up into colored bars according to the Z variable:

As the histogram has no other way to show the Z variable, this is actually a case of grouping by Z and will also mean that separate descriptive stats can be shown for each group. See this article about grouping by Z.
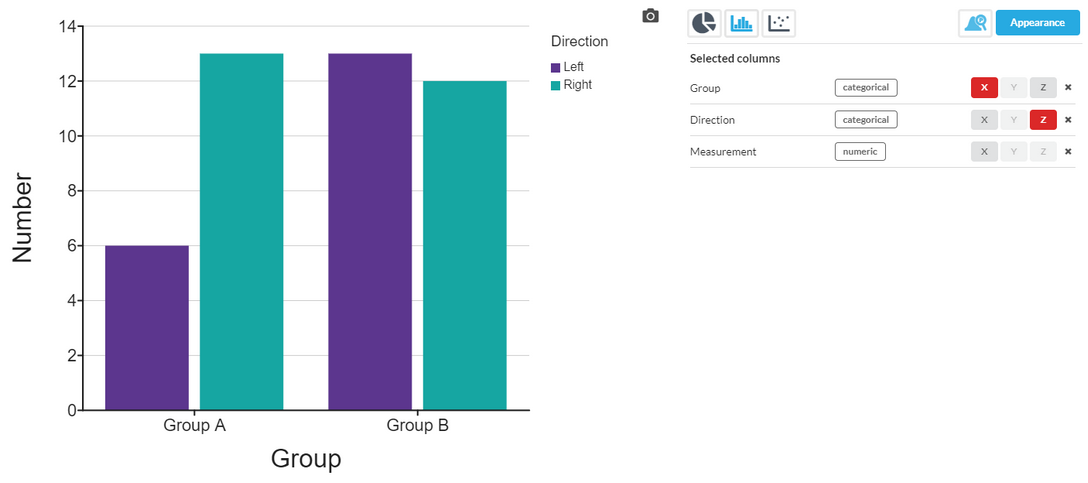
Frequency Plot
For a bar frequency plot (categorical X, categorical Z) it again splits the bars by the Z variable:
Customizing colors
In the examples above, the colors have been chosen from an automatic scale that ensures a good contrast. However, you might want to select the colors yourself. This can be done in the Values dialog for the column (located within the column header):
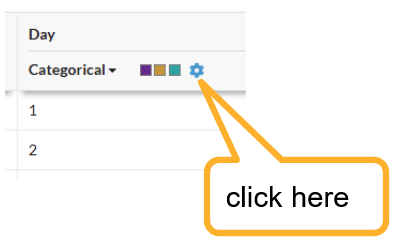
This opens the Values dialog, that allows to you set colors (and labels) for each categorical value:
See also
Setting a DataMoji for each categorical value - see here