If you want to go further and run a detailed analysis or make visualizations of the data you've generated, you can hit Create Dataset and DataClassroom will make the dataset for you, with the graph already configured to a relevant view. There are two options:
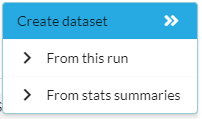
From this run makes a dataset based on the current Run, as highlighted in green and showing in your graph and table.
From stats summaries makes an aggregated dataset, containing the descriptive statistics (i.e. the mean, median etc.) from all the existing runs.
See Multiple Simulation runs for details on making multiple runs and looking at their statistics.
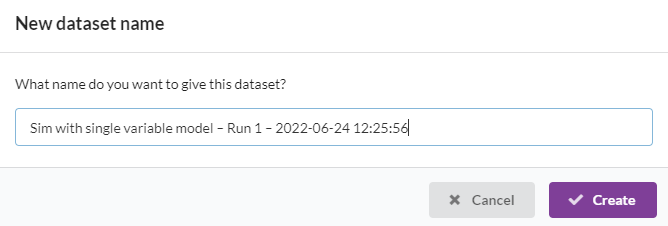
You can use the name it gives you, or edit it to make your own:
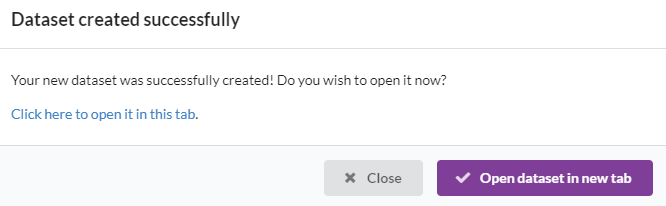
You can open the new dataset right away, usually in a new tab, so you can keep the simulation open while you look at it;
Example
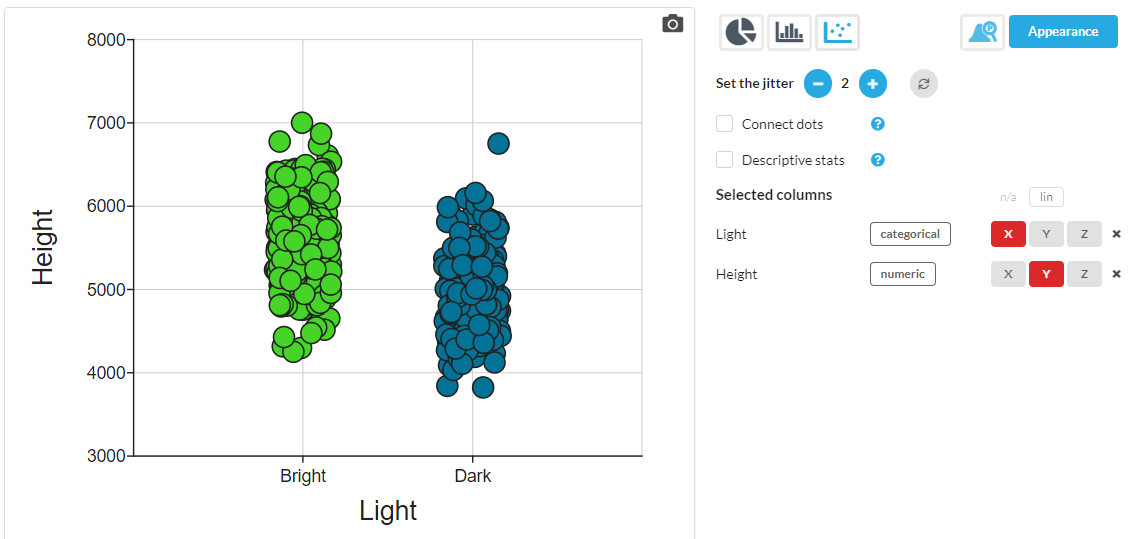
From this simulation:
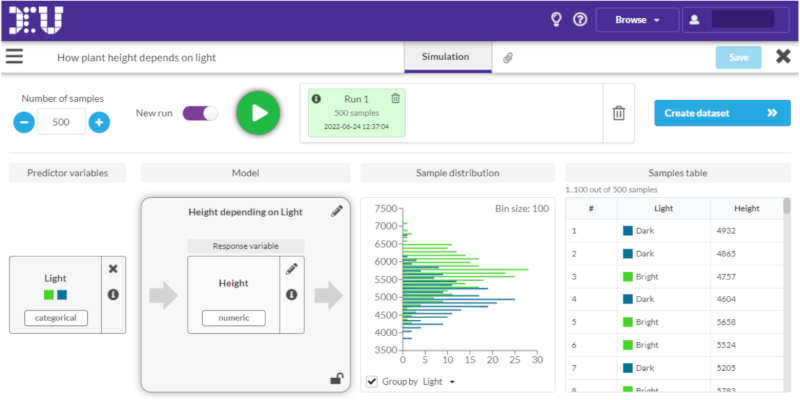
You would get this dataset by default:
Choice of default graph in the dataset
You can of course switch between a dot plot and a histogram in the Graph view with a single button click.
But you will start from:
- A dot plot, if the number of dots is "not too high" (500 at the time of writing)
- A histogram, if there are more dots than the above, as this gives a better overview.