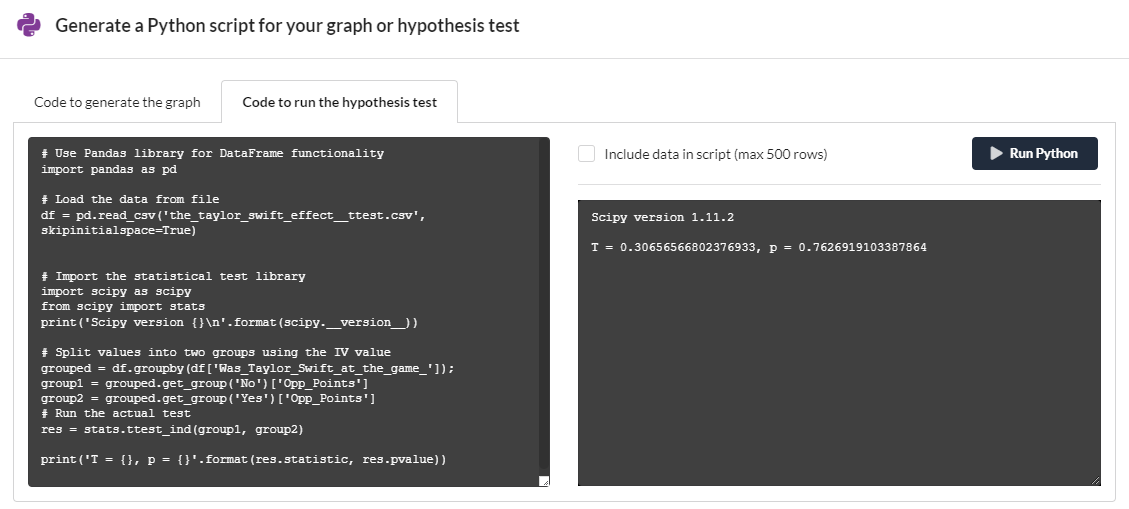
DataClassroom allows you to quickly generate self-contained, commented code in Python that can reproduce operations that you have performed using the DataClassroom user interface:
- Graphs
- Statistical tests

The Python options are found under both the Graph-Driven Test (where they can reproduce both the graph and the hypothesis test) and under the more general Hypothesis Tests interface. In both cases you need Show Advanced Options to be selected, and then there's a simple button to click to open the Python interface:


Running the Python code
You can immediately run the code produced on a DataClassroom server using the Run Python button. You'll either see a text output (from a test) or the graphical image produced by the Python code. It won't look exactly like the image from DataClassroom, but it should be pretty close.
Editing and running the Python code
For working with the code, we recommend that you copy-and-paste the Python code into a suitable Python environment, for example:
- A hosted Jupyter Notebook on Google Colab. Have a look at this T-test example on Google Colab which contains both the graphing and statistical test for a simple dataset.
- Your own Jupyter Notebook
- A hosted Python environment like PyCharm
- Python running on your own computer (see the Beginner's Guide her)
You'll then be able to run the code, and edit it as much as you like.
Data: Either check the Include data in script checkbox, which adds the data explicitly to the script, or leave it unchecked and click the blue Download data as CSV button to get the CSV file to be imported by the script which will then have a line with a df = pd.read_csv(<filename>) line. Depending on which environment you are using, you may have to edit the path of the <filename> part and/or place the CSV file somewhere particular in order to get the read_csv() command to locate it correctly.
Try it yourself on this dataset, suited to a T-test: Mosquito Wings (see above regarding college license).
Code structure and libraries
You may notice that we use a variety of plotting libraries. For example, the above example on Colab uses Seaborn's stripplot to make the dots for the dot-plot. We use Seaborn for all graphs where possible. However Seaborn does not (currently) offer a stacked bar chart or pie charts, so for these we use the Pandas native plotting functions.
For statistical tests, we use SciPy scipy.stats where possible (mostly for the simpler tests like T-test, Chi-square etc.) and Statsmodels where needed for more advanced ones such as ANCOVA, Multiple Linear Regression, etc.
Note: Where either might have been used (e.g. for linear regression), we have chosen Statsmodels in preference to Scikit-learn, as the latter is more focused on machine learning use cases, while Statsmodels is more focused on "traditional" statistical analysis and can give detailed output very similar to that from R.
You may also notice that the library import statements may not all be at the start of the code. Imports that are common for all graphs/tests are done at the start, and those for specific operations are included later, due to the code being generated in a modular form (data import and formatting first, then visualization or hypothesis tests afterwards). these imports can of course be moved to the beginning if you prefer to have them there.
Differences in output
Clearly the output from the Python code won't be identical to that from DataClassroom, and there are features in DataClassroom that are particularly tricky to reproduce closely. Histogram binning is one of these areas, as is the positioning and design of any legend. Our descriptive stats (placement as an annotation beside a dot plot) require some custom positioning code to reproduce. And only the main graphing options are included - we don't have Python equivalents for every checkbox and option.
Hopefully all the code produced does in any case provide a useful visualization and a good starting point which you can customize according to your own preferences.