If you have mastered the basics of data visualization and understand statistical tests, but want to take it to the next level in your study, then using R from the R Project is a common goal.

The two main advantages:
- It can be daunting to learn a whole new language, so it is very helpful to have some working examples to get you started.
- Installation of complicated software on your PC can be tricky. DataClassroom lets you skip this step (at first) and lets you run the code on DataClassroom's computers.
How to use
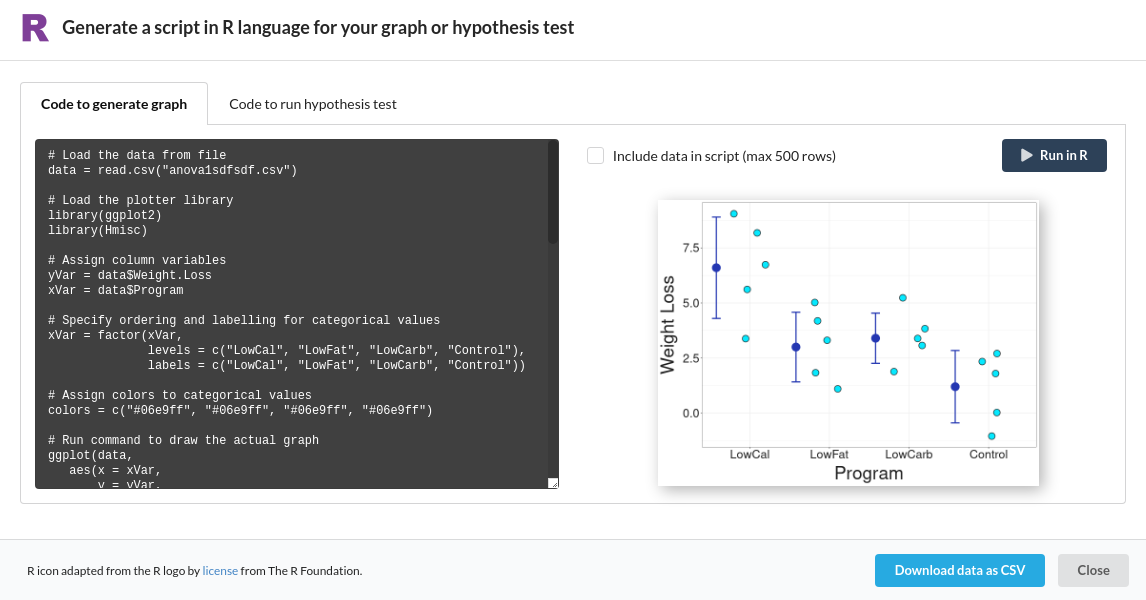
Under the Advanced features of the Graph-Driven Test screen you will see the "Try this in R" button.

This button takes your current settings for both graph and hypothesis test, and produces scripts that you can run in R to reproduce these results.
To save you the trouble of installing R, you can also run the scripts on R within DataClassroom, and see the results immediately.

Running on your own R or Rstudio installation
If you have your own R setup, you can just copy the script from the window and paste it into your own program.
There are two options for getting the actual data transferred:
- Check "Include data in script" and then just copy/paste the script with data included
- Click "Download data as CSV" and then use the read.csv() command in the script to load the data into R
You may need to edit the read.csv() command to locate the file where it has downloaded, or move the file to where R usually looks for files.
Acknowledgements
The R logo is the property of the R Foundation and is reproduced here under license.