When you or your students are new to DataClassroom or you are building a new type of graph for the first time, it can be helpful to use the Graph Wizard. This tool will walk you through a set of steps and questions to better understand your data and the type of graph that you want to make based on what you want to show with your data.
To use the Graph Wizard, start by clicking the Graph button in the 'Visualization' box in the upper right of your screen, or go to the left hand-menu under the 'bars' icon.
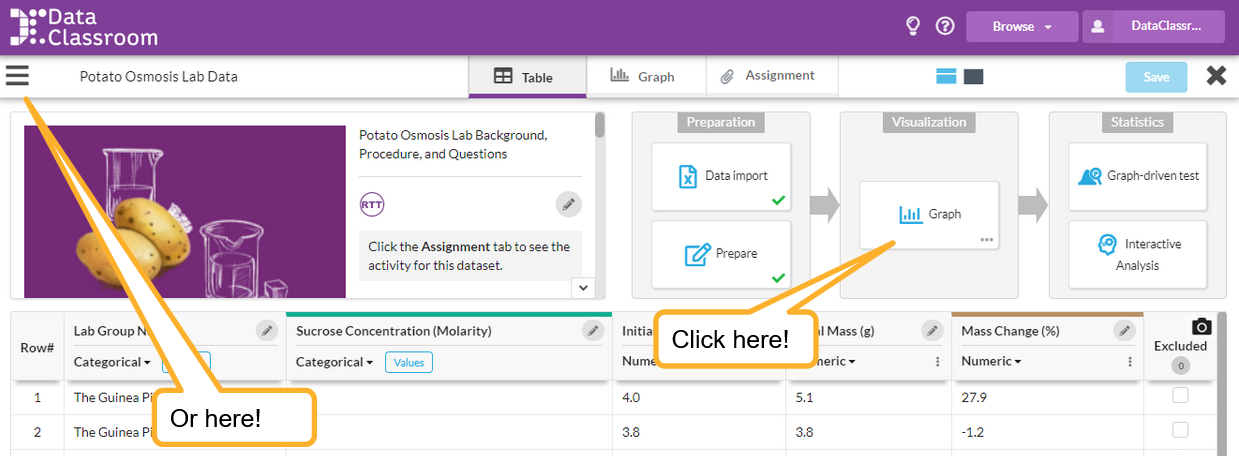
You will see a pop-up window appear with the option to click the Open the Graph Wizard button. Click this to begin.

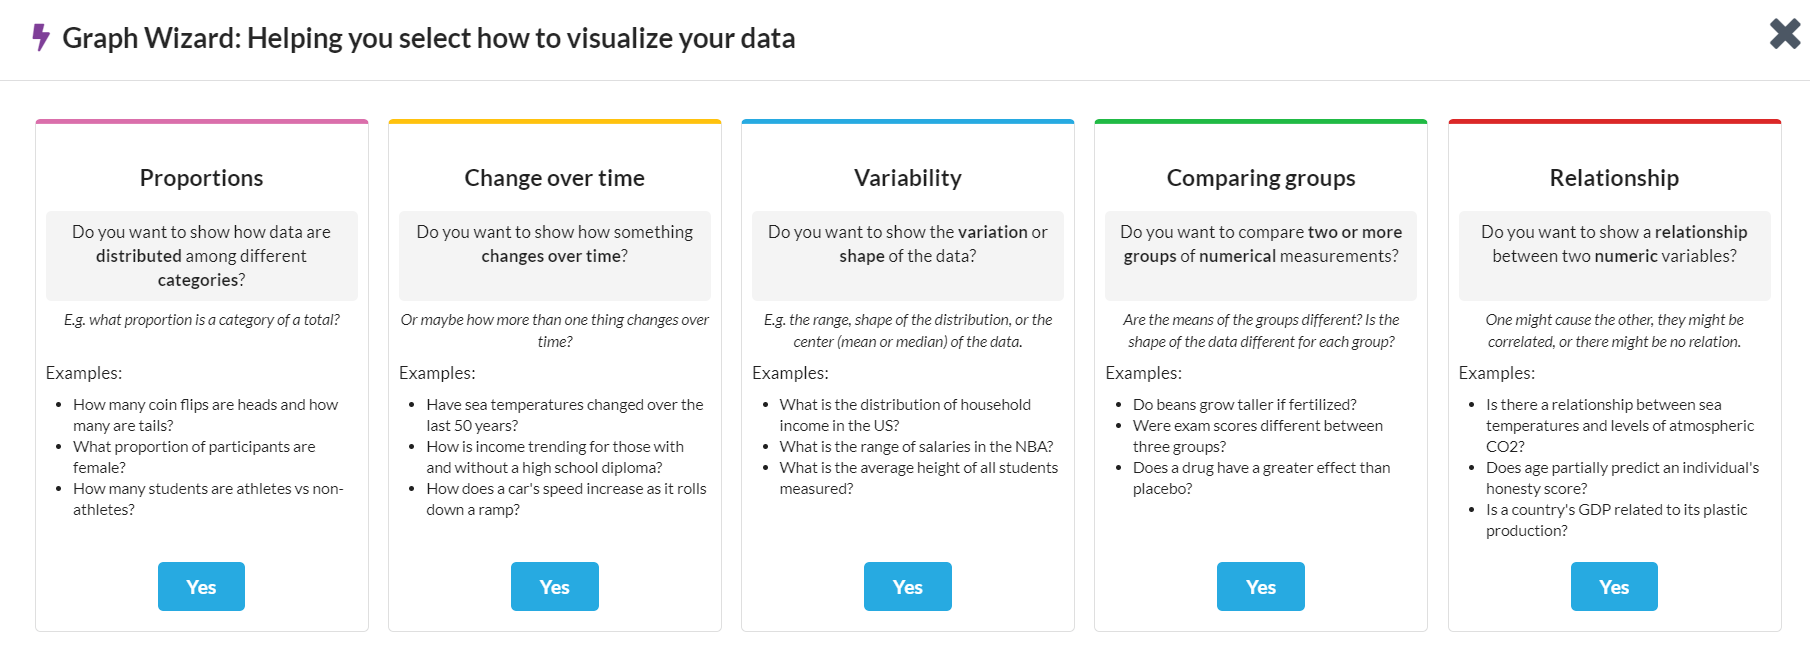
Your first set of questions will prompt you to select your primary objective. This pop-up window has descriptive questions and lists of examples that will help you chose which option best fits your data.
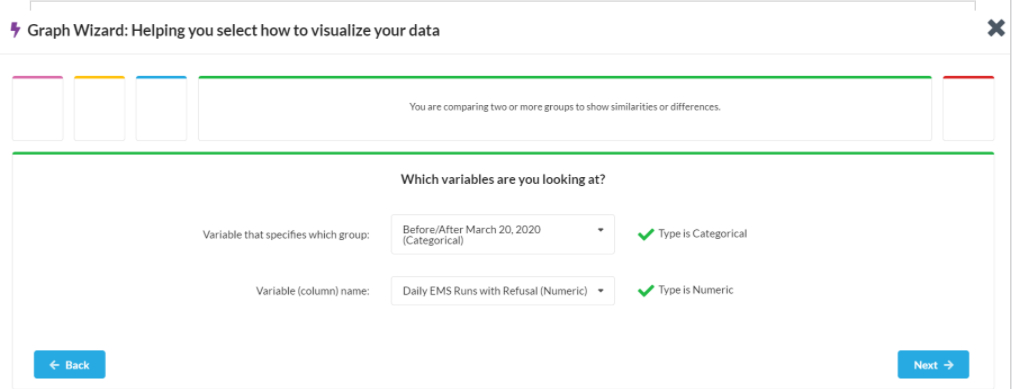
Once you have made your selection, you will be prompted to click a Next button and then choose which variables best fit the axis of your graph.
The next step will be to chose the graph that looks best for your objective from all suitable options.

Select the Yes button that best fits the graph you want to build. The final step is to chose whether you want to build the graph yourself or have the Graph Wizard show you how.
If you choose for the Graph Wizard to show you the steps, you will see another pop-up window appear that will either guide you through the steps one by one in the graphing tool or you can select for it to Do all .