It can be tricky handling time and date values in datasets. Typically they will be in a source spreadsheet in a format like one of these:
- 9/23/2023 (a date)
- 9/23/2023 14:22 (a date and time, aka a timestamp)
- 1:40 (a duration, one minute and 40 seconds)
- 12:35 PM (a time)
- 2017 (a year)
To perform any kind of numerical analysis on these values they will have to be converted into simple numeric values. You'll need to think about what corresponding value is meaningful for your graph or statistical test and also which units to use. Some examples:
- A birthdate could be converted into a persons age in years, or days.
- A recent date might be converted into a number of days since an experiment started.
- A timestamp value (date plus time) might be converted into how long a process has been applied, in hours, minutes or even seconds.
- A time value in hours and minutes (e.g. 5:33) could be converted to a duration in minutes.
Doing these conversions is best done in a spreadsheet program like Sheets or Excel, where you can perform calculations on dates and times, before importing the data to DataClassroom.
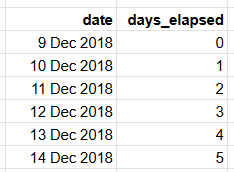
Example: converting a date into number of days:
Given the values in the first column, the days_elapsed value can be calculated.
In both Sheets and Excel, when date-formatted cells are subtracted from each other the resulting difference is the number of days.

Example: converting a duration in hours and minutes into seconds:
Here is an example using Excel. The cells in the seconds column have a formula multiplying the values in the hh:mm columns by 86400 (number of seconds in 24 hours) and are then formatted as General - to ensure they display as simple numbers.

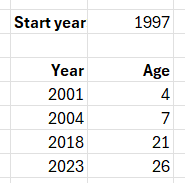
Example: changing absolute years to year numbers
A year (like 1966) is already a simple numeric value. However, it will often be good to convert it to a relative value, because it might well be the "age" or other relative value that is interesting.

Also, for regression analyses, you will have an advantage if your time values are small (like between year 1 and 10) rather than having a large offset (like from 2015 to 2025). This is maybe not obvious but a difference of 1 year is 20% of the mean value (5.5) in the first case, but only 0.2% of the mean value in the second case. This can result in loss of precision.