DataClassroom aims to make statistics more accessible to students of all ages. We see a logical progression for learning statistics that begins with descriptive statistics (mean, median, range) and goes to inferential statistics (tests that produce probability values).
Descriptive statistics
This type of statistic is a summary of a collection of information or sample of a larger population. Mean and Median are familiar descriptive statistics that can be used to determine characteristics of a sample. These are available to show in the DataClassroom graphing tool as shown below. Learn more about Descriptive Statistics here

Graph driven testing
To make selecting an appropriate statistical test easier, DataClassroom offers a Graph driven test. These inferential statistical tests are used to extrapolate information about larger population from a sample. For each dataset, DataClassroom determines the best graph driven test to run as shown below. Your students learn to apply the statistical tests and get help in interpreting that test and communicating results. Learn more about Graph Driven Hypothesis Test here.

Direct Hypothesis tests
You can skip the graph stage if you already have a good idea of what you want to test, and how. Just go directly to Hypothesis tests in the left-hand menu of your dataset and you can run any of the tests directly from there. Read more about this here.
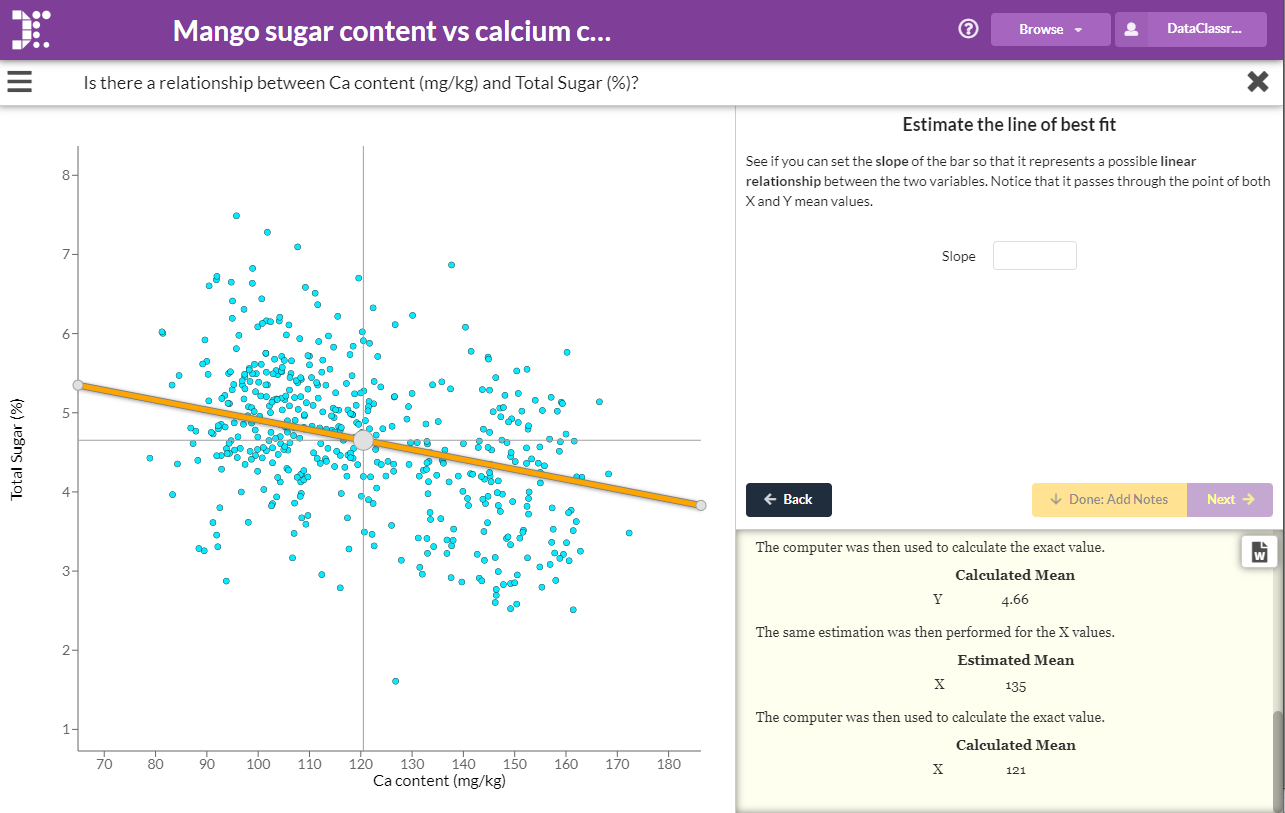
Interactive statistical analysis
When your students are ready, running an interactive analysis performs a hypothesis test (T-test, Chi-Square Goodness of Fit or Linear Regression) while visualizing the math where your students are asked to contribute and think about what is happening. This feature also writes up a 'Lab Notebook', which can be downloaded as a PDF or Google Docs compatible Word document. Learn more about Interactive Analysis here.