From the Simulation Model, you can create a new Simulation, using the Simulate... option in the left-hand menu.
You can now choose how to look at these variables:
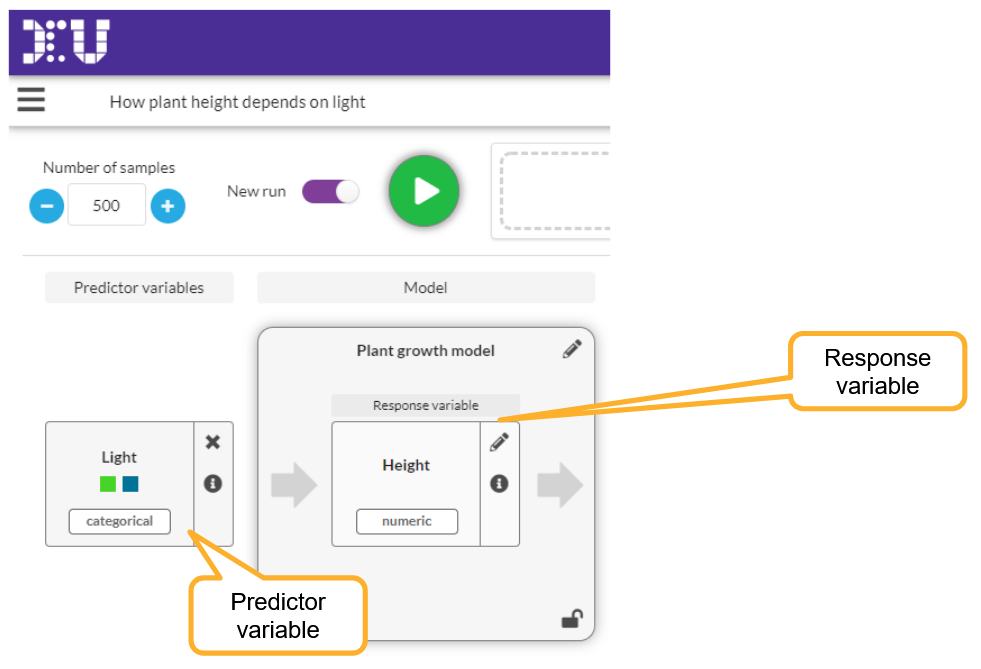
- One variable will be the Response variable. This is the main "outcome" or "property" you are looking at in your simulated experiment.
- You can also choose one or two other variables as Predictor variables. These would typically be those you are investigating to find a relationship with the Response variable.
These are shown on the Simulation screen like this:

Changing variables after having run the simulation
Changing how your simulation is set up (like switching variables) is a major change, and means that any previous results are no longer relevant. You will be asked whether you want to delete all your previous runs if you change variables in a Simulation.
Showing variables on the graph
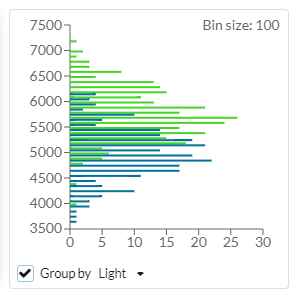
The graph will show your Response variable, either as a histogram (for numeric variables) or as bars (frequency chart) for categorical variables.
If you have a categorical predictor variable, this can be used to group the results by the variable's values, by checking the Group by checkbox.

If you have more than one predictor variable you can select which one you want to use for the visualization.
If you create a dataset from the samples in one of your runs, these settings will also be used to set up the graph in the dataset.