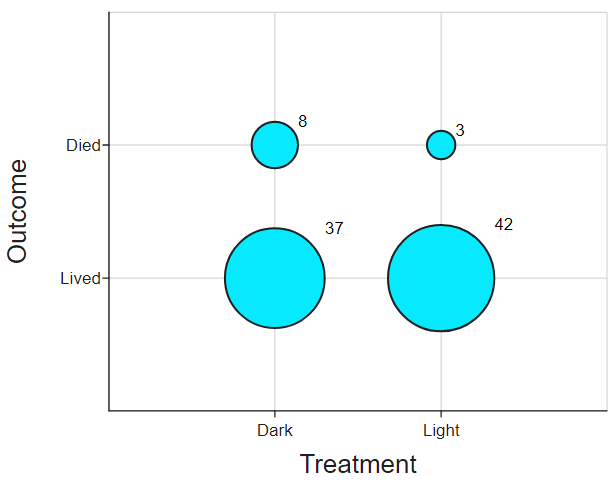
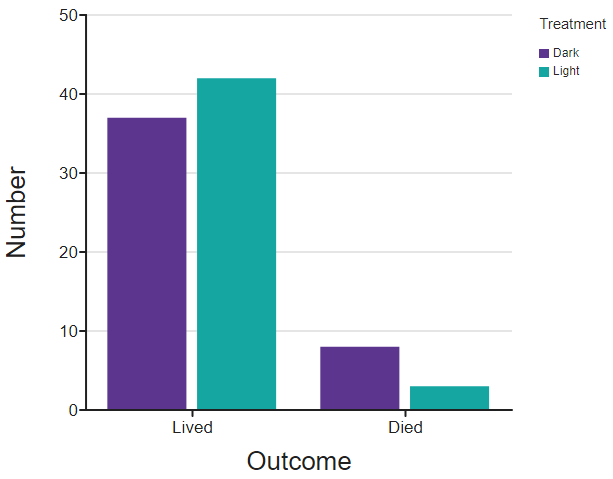
You are running an experiment to see whether light affects whether plants live or die. This time, each experimenter has 10 plants they will divide up between light and dark environments, and they will register the outcome as either "Lived" or "Died" after four weeks. Back to overview...
If you enter your results like this (you can open this example dataset in DataClassroom):

This is a good way to do the data recording. This is an example of Tidy Data (read more here) where you have one sample per row, and a column for each of your variables. You have every possible piece of data you might need.
You can now easily perform a variety of visualizations, and do statistical tests such as the Chi-square test, without having to re-format your data.


However, the table is quite long! If you are sure you are only collecting the single outcome (Lived / Died), and will not need to show individual plants in the data, you could also use the Values and Counts format. See here for more information.