If your data has been grouped by a categorical Z variable with a regression line added, then each group will have a separate regression line.
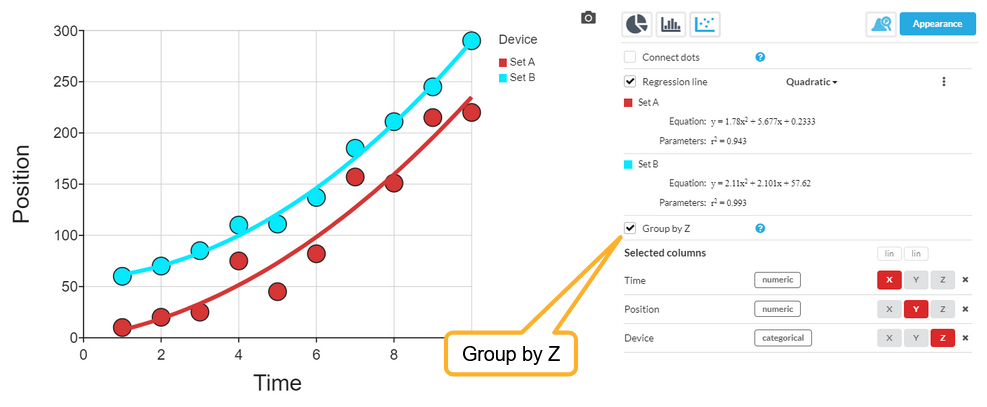
As you can see, you also get a separate equation and r2 result for each regression.
The colors can be controlled in the Values button on the column used for the Z variable.
You can also set the regression lines to have a single common color, see under Appearance -> Force common color.