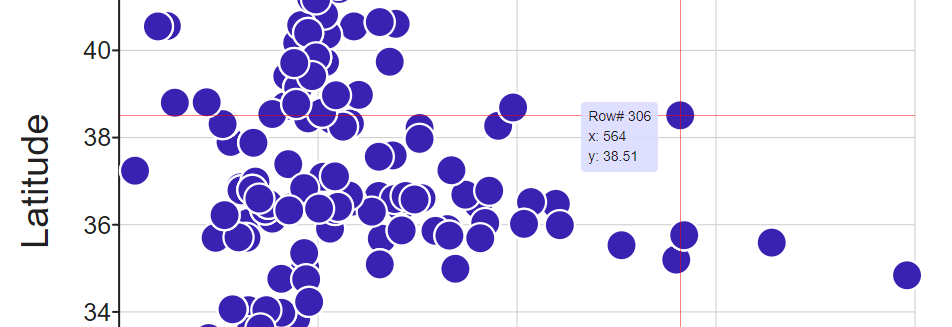
When you make a Scatter or Dot Plot, you'll notice that hovering on the data points lets you see the values of the variables on your X, Y and 'Z' axes, and which row the data came from:

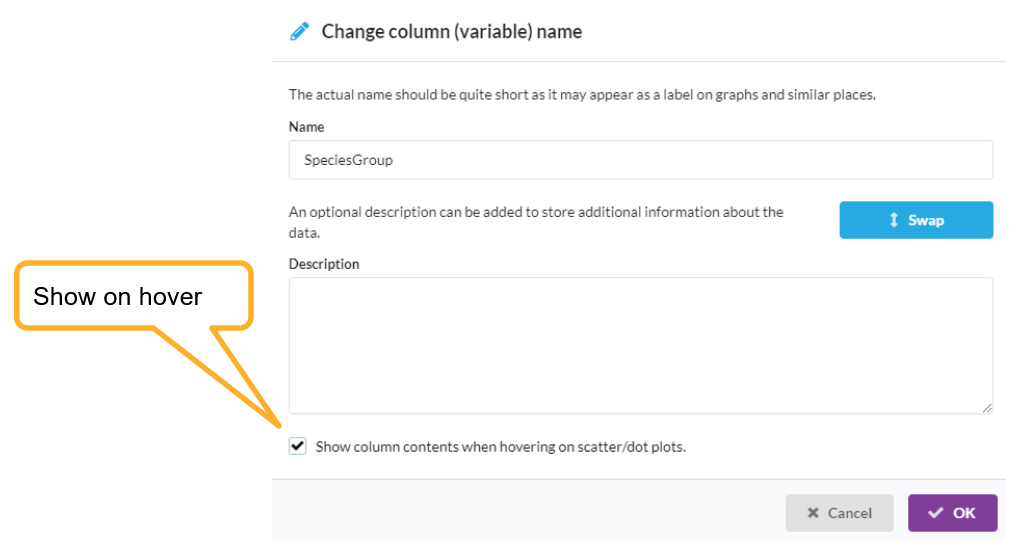
You can also use the contents of another non-graphed column to label each point. For example, we can add the column SpeciesGroup to the above scatter plot, by clicking on the "edit column header" icon:

Then, checking the Show column contents when hovering... box:

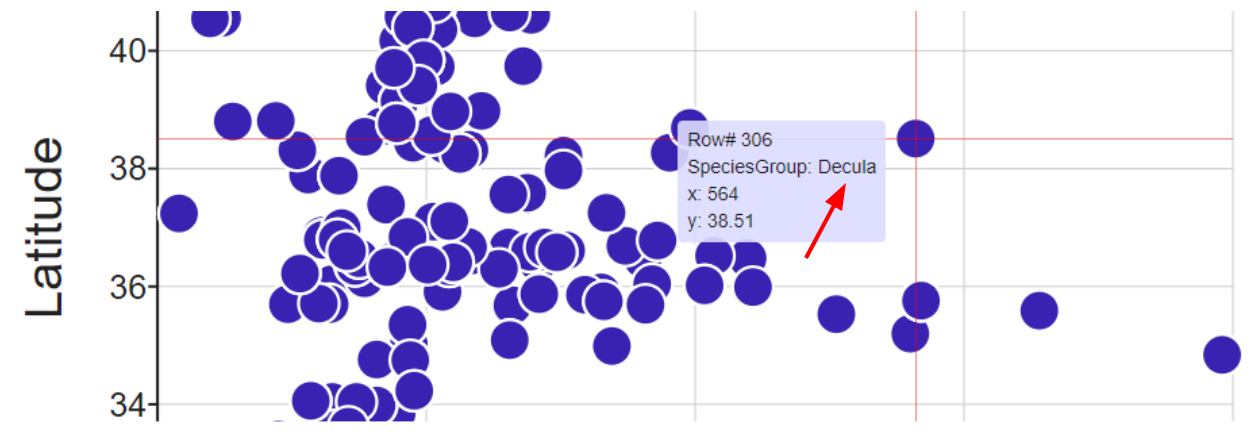
Any columns that have this box checked will have the contents of that column added to the hover info:

This can be really useful in identifying outliers, for example.