Defining how two numeric variables are related involves setting the slope of the relationship.
It's called slope as that is how it looks when plotting the response variable on the Y axis and the predictor variable on the X axis, the visual impression of the interaction is the slope of the line of best fit.
y = slope * x + offset
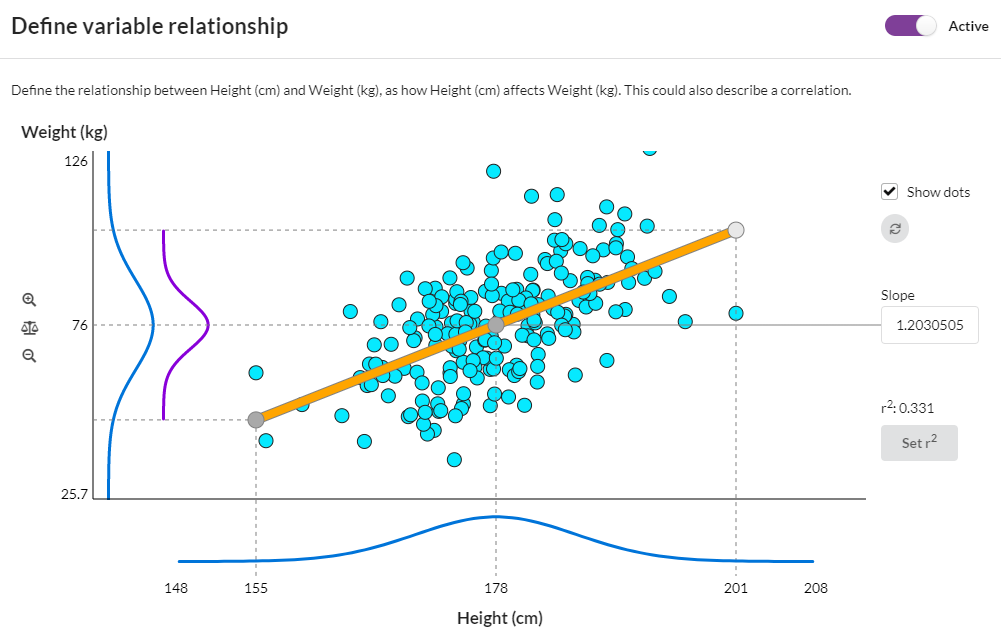
The interface to define this slope shows the slope as the orange line, and you can set the slope by either dragging the line or typing in your slope value.

What are the blue and purple curves?
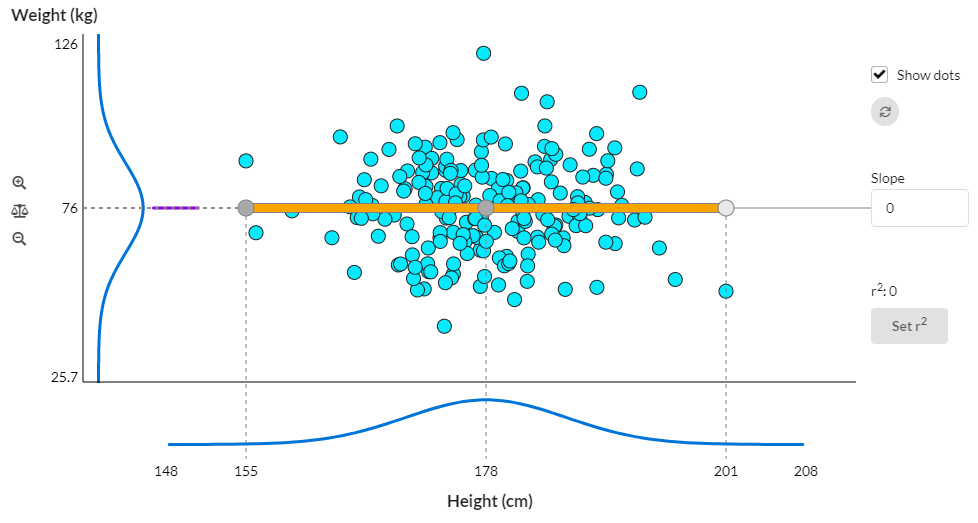
The blue curves show the nominal normal distributions for these two numeric variables, i.e. before any effect of the connection has been taken into account. You'll see if you set the slope to zero, the Y axis variable still has its inherent variability shown by its blue curve.
The purple curve shows the variability in Y that is due to the slope. You can judge for yourself the comparative sizes of the blue and purple curves, which gives an idea of the proportion of the Y variability that is explained by variation in X, compared its natural variation.
With a slope of zero, the purple curve goes to zero area:

What are the blue dots?
The blue dots are randomly generated and are there purely to illustrate what a possible set of sample values might look like with the given settings. You can turn them off if you don't like them, they have no effect on the output of the simulation.
Setting r2
The value of r2 (R-squared) shown is the value you would approach if you ran a Linear Regression analysis on data generated for these two variables, assuming you generated many samples. (The more samples, the more your r2 values will approach the value shown).
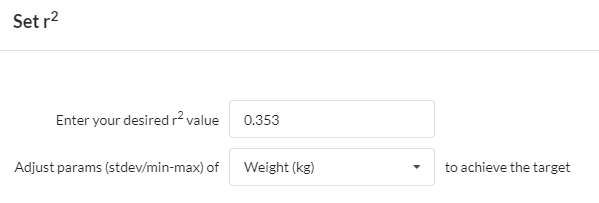
If you want to set up a simulation model that will generate a particular value of r2, having set your slope, you can click Set r2.

Warning: this will change the standard deviation settings for one of the variables, by default the Y variable.
This is because to make r2 closer to 1.00 (for instance) you need to reduce the amount of variation NOT given by the slope and the X variable, and this can only be done by reducing the Y variable's standard deviation. Or vice-versa.
You'll see if you set R-squared to 1 the result is that the Y variable gets zero standard deviation.