What are the most common DataClassroom features teachers and students use?
Classroom-Ready lesson plans
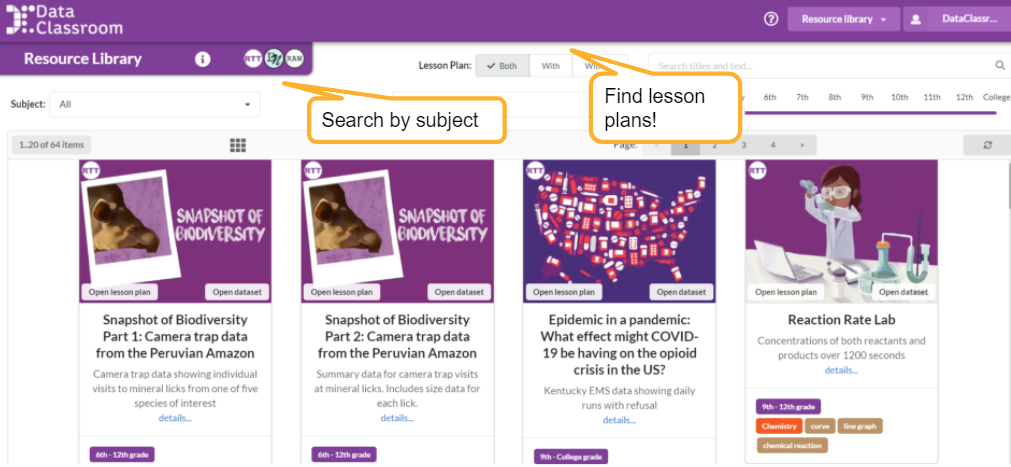
Our Resource Library contains ready made lesson plans and datasets that you can use to get up and running working with data. These are searchable by subject, grade level and topic. See the article Using the Resource Library for more information.
Graphing data
DataClassroom provides a powerful and flexible tool for students to graph data. Check out all of our resources available to help you and your students get the most out of graphing in DataClassroom in the Graphing Overview.

Working with your own data
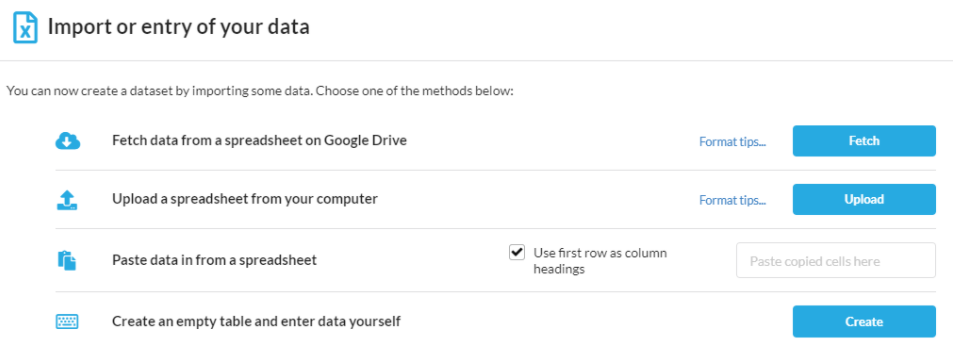
DataClassroom allows you and your students to import or create your own datasets. Check out our tutorials on preparing and importing data to help you get started!
Statistics
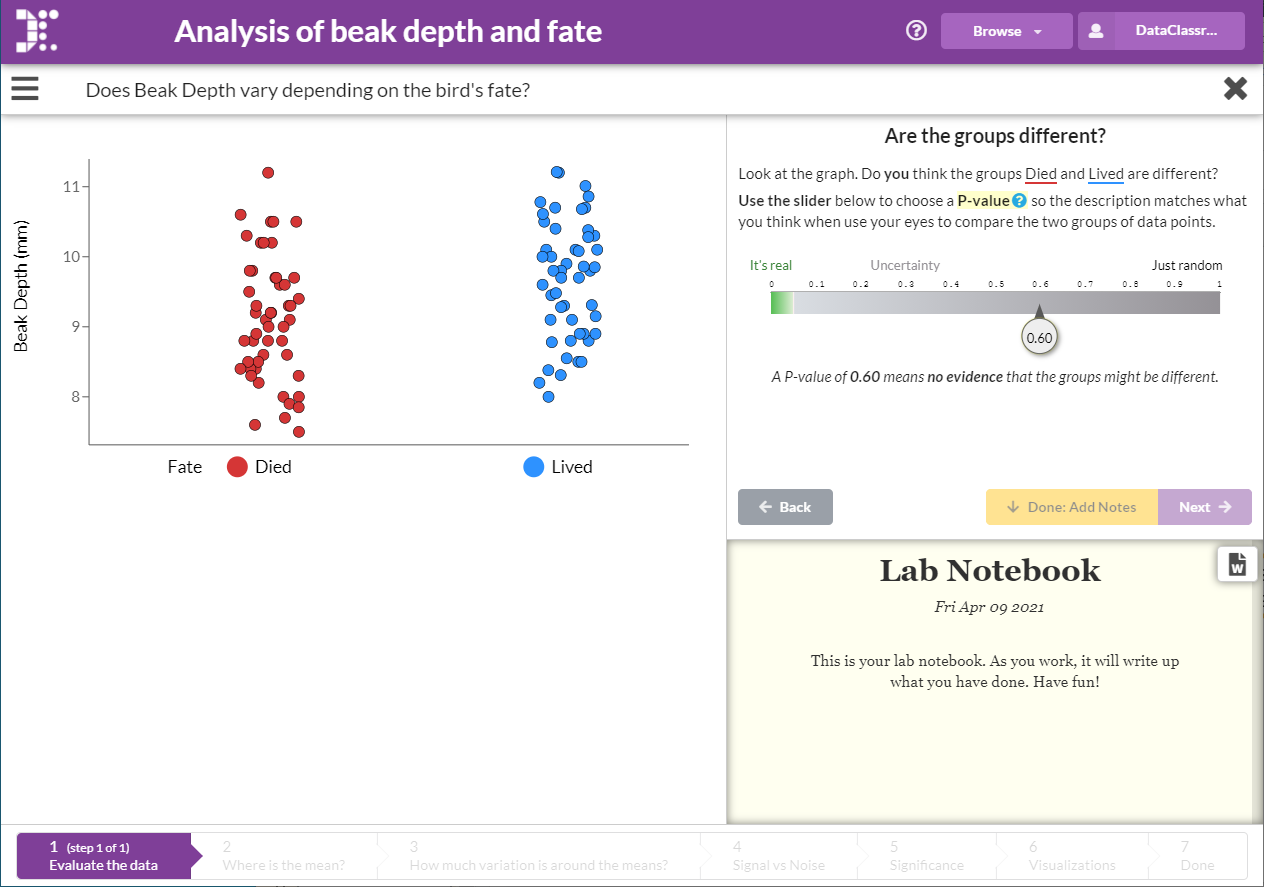
DataClassroom has built in scaffolding to let your students move from simple graphing to statistical tests. This starts with Descriptive Statistics like mean and median and progresses to Graph Driven Tests or the more math intensive Interactive Analysis. Your students will learn statistical concepts by doing progressive work in DataClassroom.
And beyond....
Students doing an advanced research class? Or getting started at college with more hard-core statistical analysis and visualization?

DataClassroom U is our "next level" feature set, designed for College-level topics. It features more advanced statistical tests and an easy way to get started using professional grade tools such as R for both visualization and tests. Read more here...
The DataClassroom U feature set is under constant development. Contact us to discuss our roadmap features!