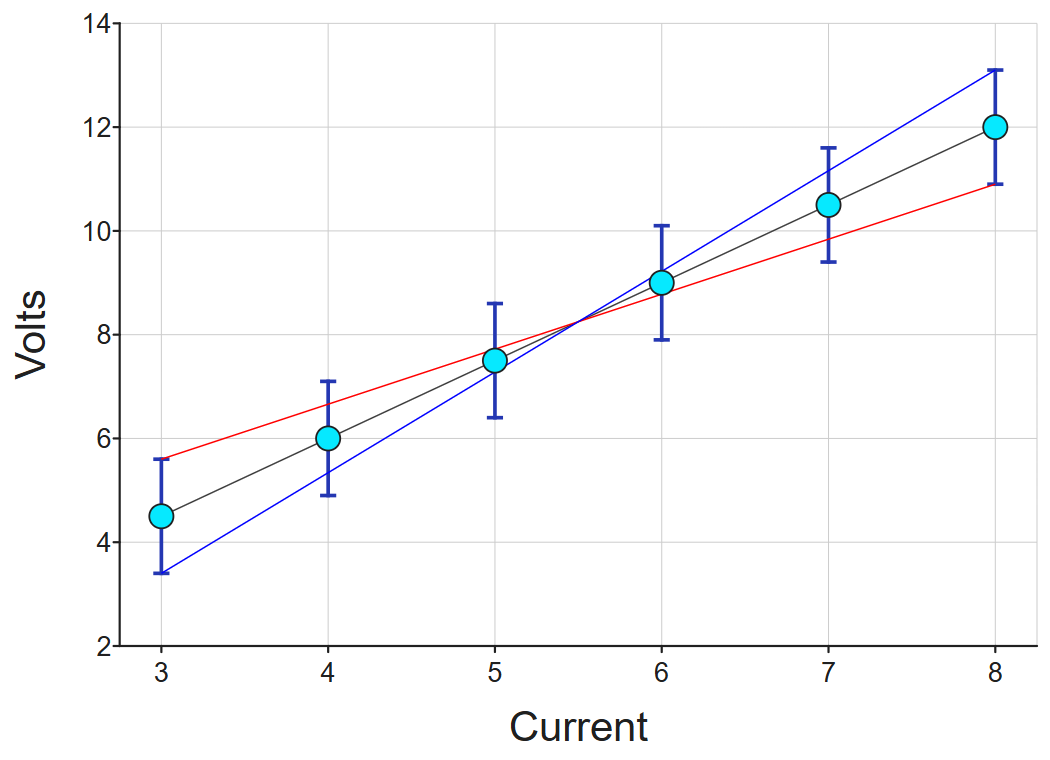
If you have a set of X,Y data points where the uncertainties are available as values in your data table, then the Custom error bars feature allows you to show these on your graph:
This could e.g. be useful in IB Physics exercises where you are trying to determine a result from a gradient, and want to work out the uncertainty.
The Custom error bars can be used when you have a set of single data points on two numeric axes (If you don't see the checkbox, read this):
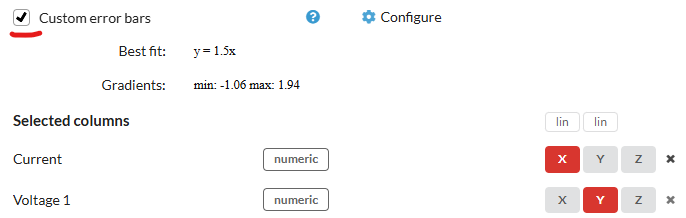
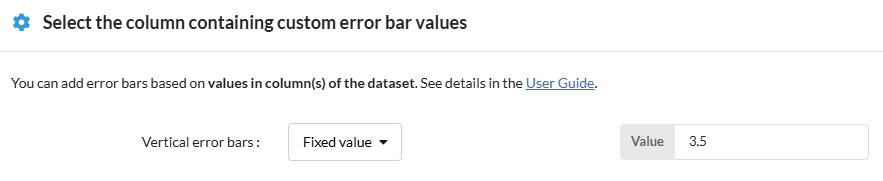
The configuration dialog allows you to choose which column to take the error bar values from, or you can set all error bars to the same fixed value (for example a measurement uncertainty):
It also lets you add a line of best fit (to determine the gradient) and the maximum and minimum gradients based on the error bars, in order to determine the uncertainty:
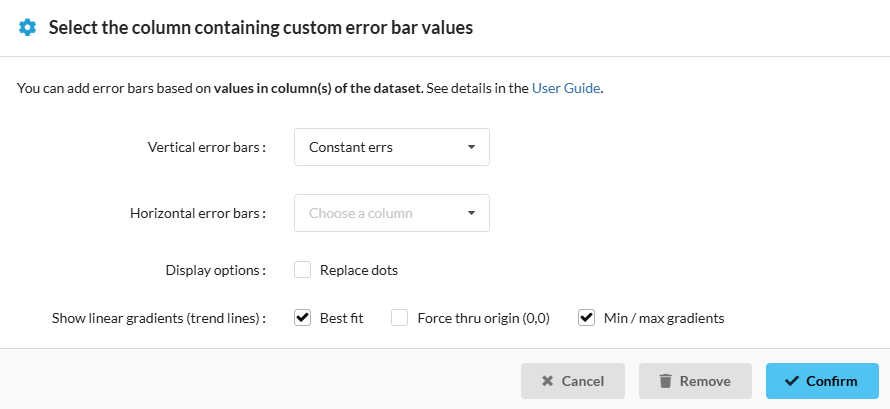
The line of best fit is calculated with a least squares linear regression. With the force through origin option set, the resulting equation will have no constant coefficient. This provides a more accurate result in cases where you know that 0,0 must be an exact point (for example if the voltage is zero, the current must also be exactly zero).
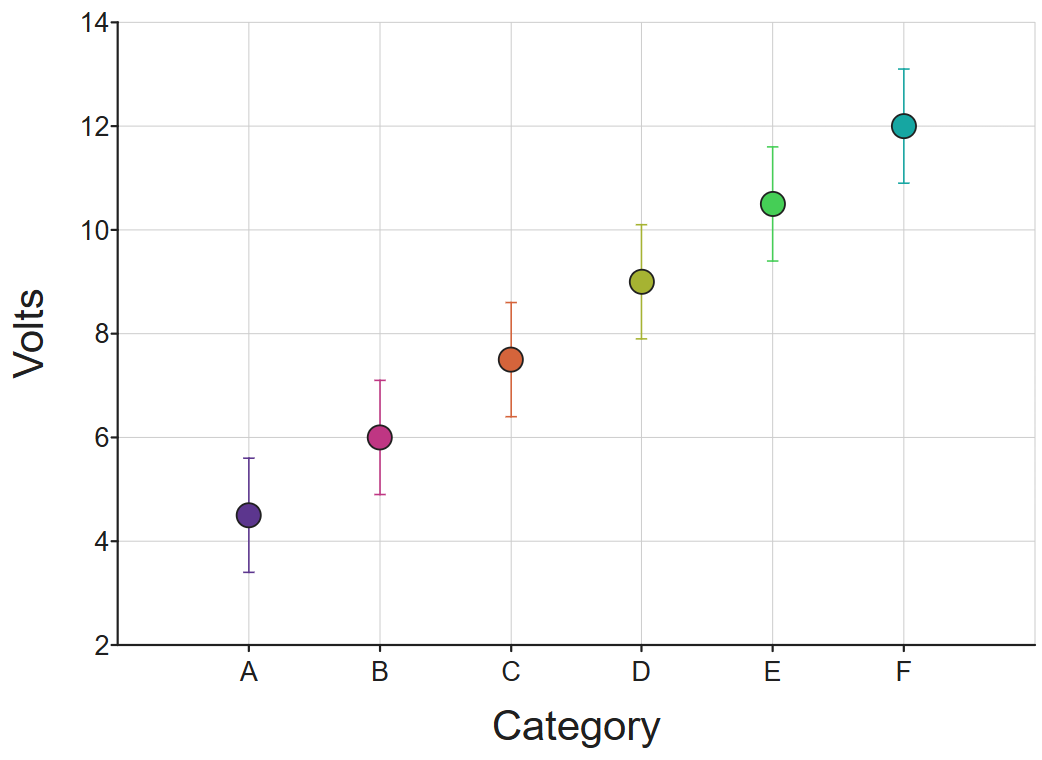
With categorical X axis
Error bars can also be shown when the X axis is categorical. But in this case no gradient can be shown or calculated:
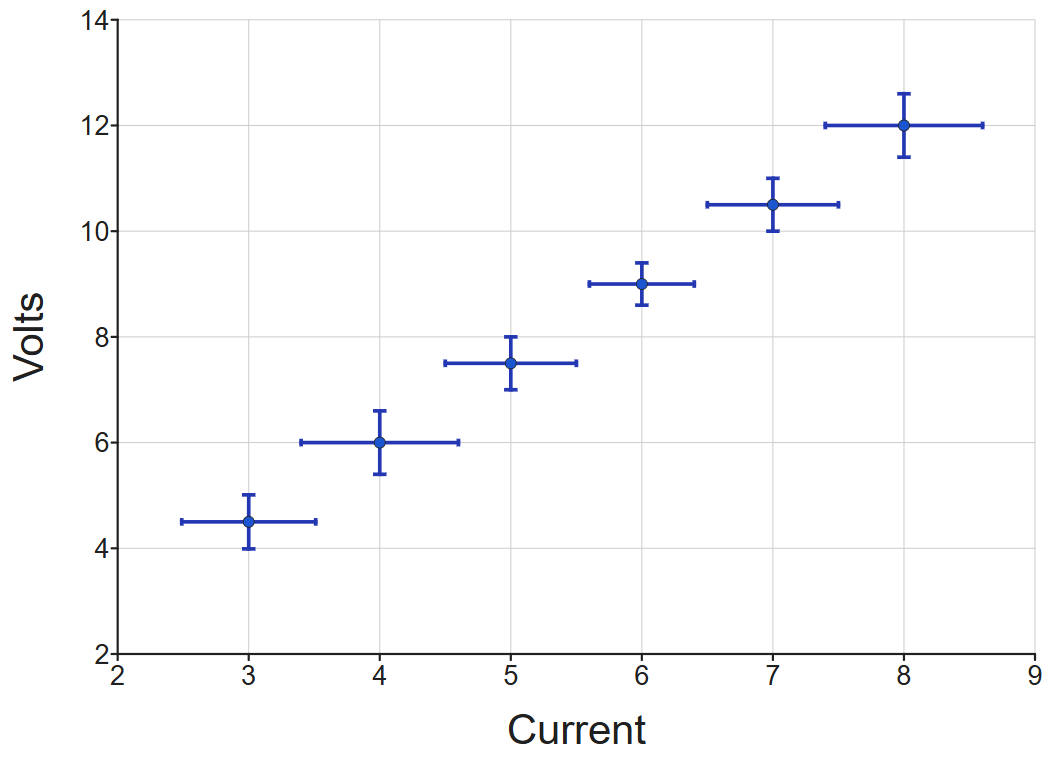
Bidirectional error bars
With both X and Y axes numerical, horizontal error bars can be shown, either alone or together with the vertical bars:
Display options and appearance
The custom error bars take their default appearance from the same place as the controls for descriptive statistics, i.e. color, width etc:
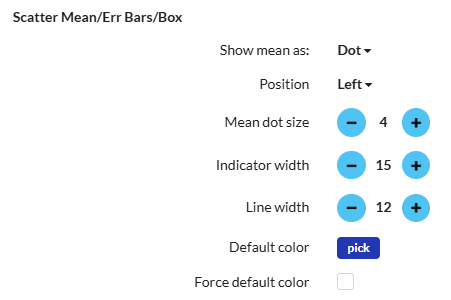
Note: The "show mean as" and "position" controls are unused for error bars.
You can also choose whether the error bar dots replace the normal dots showing the data points using the option in the error bars configuration dialog:

Not seeing the checkbox?
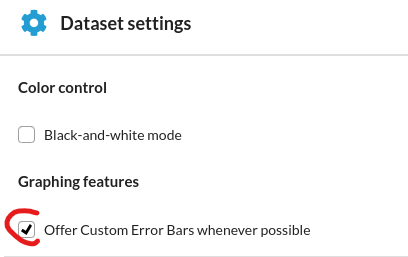
The checkbox is usually shown when the tool detects that these error bars should be relevant. If you don't see the checkbox, try checking this option under Dataset Settings (see where):